Publications
This page is automatically generated from the White Rose database using name-string queries. It has known inaccuracies - please contact the authors directly to confirm data.
Unsupervised image translation (UIT) studies the mapping between two image domains. Since such mappings are under-constrained, existing research has pursued various desirable properties such as distributional matching or two-way consistency. In this paper, we re-examine UIT from a new perspective: distributional semantics consistency, based on the observation that data variations contain semantics, e.g., shoes varying in colors. Further, the semantics can be multi-dimensional, e.g., shoes also varying in style, functionality, etc. Given two image domains, matching these semantic dimensions during UIT will produce mappings with explicable correspondences, which has not been investigated previously. We propose distributional semantics mapping (DSM), the first UIT method which explicitly matches semantics between two domains. We show that distributional semantics has been rarely considered within and beyond UIT, even though it is a common problem in deep learning. We evaluate DSM on several benchmark datasets, demonstrating its general ability to capture distributional semantics. Extensive comparisons show that DSM not only produces explicable mappings, but also improves image quality in general.
@article{wrro186930,
volume = {9},
number = {3},
month = {September},
author = {Z Peng and H Wang and Y Yang and Y Yang and T Shao},
note = {{\copyright} The Author(s) 2023. This article is licensed under a Creative
Commons Attribution 4.0 International License, which
permits use, sharing, adaptation, distribution and reproduction
in any medium or format, as long as you give appropriate
credit to the original author(s) and the source, provide a link
to the Creative Commons licence, and indicate if changes
were made.
The images or other third party material in this article are
included in the article?s Creative Commons licence, unless
indicated otherwise in a credit line to the material. If material
is not included in the article?s Creative Commons licence and
your intended use is not permitted by statutory regulation or
exceeds the permitted use, you will need to obtain permission
directly from the copyright holder.
To view a copy of this licence, visit http://
creativecommons.org/licenses/by/4.0/.},
title = {Unsupervised image translation with distributional semantics awareness},
publisher = {SpringerOpen},
year = {2023},
journal = {Computational Visual Media},
pages = {619--631},
keywords = {generative adversarial networks (GANs);
manifold alignment; unsupervised learning;
image-to-image translation; distributional
semantics},
url = {https://eprints.whiterose.ac.uk/186930/},
abstract = {Unsupervised image translation (UIT) studies the mapping between two image domains. Since such mappings are under-constrained, existing research has pursued various desirable properties such as distributional matching or two-way consistency. In this paper, we re-examine UIT from a new perspective: distributional semantics consistency, based on the observation that data variations contain semantics, e.g., shoes varying in colors. Further, the semantics can be multi-dimensional, e.g., shoes also varying in style, functionality, etc. Given two image domains, matching these semantic dimensions during UIT will produce mappings with explicable correspondences, which has not been investigated previously. We propose distributional semantics mapping (DSM), the first UIT method which explicitly matches semantics between two domains. We show that distributional semantics has been rarely considered within and beyond UIT, even though it is a common problem in deep learning. We evaluate DSM on several benchmark datasets, demonstrating its general ability to capture distributional semantics. Extensive comparisons show that DSM not only produces explicable mappings, but also improves image quality in general.}
}Skeletal motions have been heavily relied upon for human activity recognition (HAR). Recently, a universal vulnerability of skeleton-based HAR has been identified across a variety of classifiers and data, calling for mitigation. To this end, we propose the first black-box defense method for skeleton-based HAR to our best knowledge. Our method is featured by full Bayesian treatments of the clean data, the adversaries and the classifier, leading to (1) a new Bayesian Energy-based formulation of robust discriminative classifiers, (2) a new adversary sampling scheme based on natural motion manifolds, and (3) a new post-train Bayesian strategy for black-box defense. We name our framework Bayesian Energy-based Adversarial Training or BEAT. BEAT is straightforward but elegant, which turns vulnerable black-box classifiers into robust ones without sacrificing accuracy. It demonstrates surprising and universal effectiveness across a wide range of skeletal HAR classifiers and datasets, under various attacks. Appendix and code are available.
@misc{wrro193975,
volume = {37},
number = {2},
month = {June},
author = {H Wang and Y Diao and Z Tan and G Guo},
booktitle = {The 37th AAAI conference on Aritificial Intelligence},
title = {Defending Black-box Skeleton-based Human Activity Classifiers},
address = {Washington, DC},
publisher = {AAAI},
year = {2023},
journal = {Proceedings of the AAAI Conference on Artificial Intelligence},
pages = {2546--2554},
keywords = {CV: Adversarial Attacks \& Robustness, CV: Motion \& Tracking},
url = {https://eprints.whiterose.ac.uk/193975/},
abstract = {Skeletal motions have been heavily relied upon for human activity recognition (HAR). Recently, a universal vulnerability of skeleton-based HAR has been identified across a variety of classifiers and data, calling for mitigation. To this end, we propose the first black-box defense method for skeleton-based HAR to our best knowledge. Our method is featured by full Bayesian treatments of the clean data, the adversaries and the classifier, leading to (1) a new Bayesian Energy-based formulation of robust discriminative classifiers, (2) a new adversary sampling scheme based on natural motion manifolds, and (3) a new post-train Bayesian strategy for black-box defense. We name our framework Bayesian Energy-based Adversarial Training or BEAT. BEAT is straightforward but elegant, which turns vulnerable black-box classifiers into robust ones without sacrificing accuracy. It demonstrates surprising and universal effectiveness across a wide range of skeletal HAR classifiers and datasets, under various attacks. Appendix and code are available.}
}We present a novel traffic trajectory editing method which uses spatio-temporal keyframes to control vehicles during the simulation to generate desired traffic trajectories. By taking self-motivation, path following and collision avoidance into account, the proposed force-based traffic simulation framework updates vehicle's motions in both the Frenet coordinates and the Cartesian coordinates. With the way-points from users, lane-level navigation can be generated by reference path planning. With a given keyframe, the coarse-to-fine optimization is proposed to efficiently generate the plausible trajectory which can satisfy the spatio-temporal constraints. At first, a directed state-time graph constructed along the reference path is used to search for a coarse-grained trajectory by mapping the keyframe as the goal. Then, using the information extracted from the coarse trajectory as initialization, adjoint-based optimization is applied to generate a finer trajectory with smooth motions based on our force-based simulation. We validate our method with extensive experiments.
@article{wrro191396,
volume = {41},
number = {7},
month = {March},
author = {Y Han and H Wang and X Jin},
note = {{\copyright} 2022 The Author(s) Computer Graphics Forum {\copyright} 2022 The Eurographics Association and John Wiley \& Sons Ltd. Published by John Wiley \& Sons Ltd. This is the peer reviewed version of the following article: Han, Y., Wang, H. and Jin, X. (2022), Spatio-temporal Keyframe Control of Traffic Simulation using Coarse-to-Fine Optimization. Computer Graphics Forum, 41: 541-552, which has been published in final form at https://doi.org/10.1111/cgf.14699. This article may be used for non-commercial purposes in accordance with Wiley Terms and Conditions for Use of Self-Archived Versions. This article may not be enhanced, enriched or otherwise transformed into a derivative work, without express permission from Wiley or by statutory rights under applicable legislation. Copyright notices must not be removed, obscured or modified. The article must be linked to Wiley?s version of record on Wiley Online Library and any embedding, framing or otherwise making available the article or pages thereof by third parties from platforms, services and websites other than Wiley Online Library must be prohibited.},
title = {Spatio-temporal Keyframe Control of Traffic Simulation using Coarse-to-Fine Optimization},
publisher = {Wiley},
year = {2023},
journal = {Computer Graphics Forum},
pages = {541--552},
keywords = {CCS Concepts; Computing methodologies {$\rightarrow$} Procedural animation; Interactive simulation},
url = {https://eprints.whiterose.ac.uk/191396/},
abstract = {We present a novel traffic trajectory editing method which uses spatio-temporal keyframes to control vehicles during the simulation to generate desired traffic trajectories. By taking self-motivation, path following and collision avoidance into account, the proposed force-based traffic simulation framework updates vehicle's motions in both the Frenet coordinates and the Cartesian coordinates. With the way-points from users, lane-level navigation can be generated by reference path planning. With a given keyframe, the coarse-to-fine optimization is proposed to efficiently generate the plausible trajectory which can satisfy the spatio-temporal constraints. At first, a directed state-time graph constructed along the reference path is used to search for a coarse-grained trajectory by mapping the keyframe as the goal. Then, using the information extracted from the coarse trajectory as initialization, adjoint-based optimization is applied to generate a finer trajectory with smooth motions based on our force-based simulation. We validate our method with extensive experiments.}
}Crowd simulation methods generally focus on high fidelity 2D trajectories but ignore detailed 3D body animation which is normally added in a post-processing step. We argue that this is an intrinsic flaw as detailed body motions affect the 2D trajectories, especially when interactions are present between characters, and characters and the environment. In practice, this requires labor-intensive post-processing, fitting individual character animations onto simulated trajectories where anybody interactions need to be manually specified. In this paper, we propose a new framework to integrate the modeling of crowd motions with character motions, to enable their mutual influence, so that crowd simulation also incorporates agent-agent and agent-environment interactions. The whole framework is based on a three-level hierarchical control structure to effectively control the scene at different scales efficiently and consistently. To facilitate control, each character is modeled as an agent governed by four modules: visual system, blackboard system, decision system, and animation system. The animation system of the agent model consists of two modes: a traditional Finite State Machine (FSM) animation mode, and a motion matching mode. So an agent not only retains the flexibility of FSMs, but also has the advantage of motion matching which adapts detailed body movements for interactions with other agents and the environment. Our method is universal and applicable to most interaction scenarios in various environments in crowd animation, which cannot be achieved by prior work. We validate the fluency and realism of the proposed method by extensive experiments and user studies.
@misc{wrro187875,
volume = {13443},
month = {January},
author = {X Yao and S Wang and W Sun and H Wang and Y Wang and X Jin},
series = {Lecture Notes in Computer Science},
note = {{\copyright} 2022 The Author(s). This is an author produced version of a conference paper published in Advances in Computer Graphics. Uploaded in accordance with the publisher's self-archiving policy.},
booktitle = {39th Computer Graphics International Conference, CGI 2022},
editor = {N Magnenat-Thalmann and J Zhang and J Kim and G Papagiannakis and B Sheng and D Thalmann and M Gavrilova},
title = {Crowd Simulation with Detailed Body Motion and Interaction},
publisher = {Springer},
year = {2023},
journal = {Advances in Computer Graphics},
pages = {227--238},
url = {https://eprints.whiterose.ac.uk/187875/},
abstract = {Crowd simulation methods generally focus on high fidelity 2D trajectories but ignore detailed 3D body animation which is normally added in a post-processing step. We argue that this is an intrinsic flaw as detailed body motions affect the 2D trajectories, especially when interactions are present between characters, and characters and the environment. In practice, this requires labor-intensive post-processing, fitting individual character animations onto simulated trajectories where anybody interactions need to be manually specified. In this paper, we propose a new framework to integrate the modeling of crowd motions with character motions, to enable their mutual influence, so that crowd simulation also incorporates agent-agent and agent-environment interactions. The whole framework is based on a three-level hierarchical control structure to effectively control the scene at different scales efficiently and consistently. To facilitate control, each character is modeled as an agent governed by four modules: visual system, blackboard system, decision system, and animation system. The animation system of the agent model consists of two modes: a traditional Finite State Machine (FSM) animation mode, and a motion matching mode. So an agent not only retains the flexibility of FSMs, but also has the advantage of motion matching which adapts detailed body movements for interactions with other agents and the environment. Our method is universal and applicable to most interaction scenarios in various environments in crowd animation, which cannot be achieved by prior work. We validate the fluency and realism of the proposed method by extensive experiments and user studies.}
}The use of good-quality data to inform decision making is entirely dependent on robust processes to ensure it is fit for purpose. Such processes vary between organisations, and between those tasked with designing and following them. In this paper we report on a survey of 53 data analysts from many industry sectors, 24 of whom also participated in in-depth interviews, about computational and visual methods for characterizing data and investigating data quality. The paper makes contributions in two key areas. The first is to data science fundamentals, because our lists of data profiling tasks and visualization techniques are more comprehensive than those published elsewhere. The second concerns the application question ?what does good profiling look like to those who routinely perform it?,? which we answer by highlighting the diversity of profiling tasks, unusual practice and exemplars of visualization, and recommendations about formalizing processes and creating rulebooks.
@article{wrro197083,
month = {January},
title = {Tasks and Visualizations Used for Data Profiling: A Survey and Interview Study},
author = {RA Ruddle and J Cheshire and SJ Fernstad},
publisher = {Institute of Electrical and Electronics Engineers},
year = {2023},
note = {{\copyright} 2023, IEEE. Personal use of this material is permitted. Permission from IEEE must be obtained for all other uses, in any current or future media, including reprinting/republishing this material for advertising or promotional purposes, creating new collective works, for resale or redistribution to servers or lists, or reuse of any copyrighted component of this work in other works.},
journal = {IEEE Transactions on Visualization and Computer Graphics},
keywords = {Data visualization , Task analysis , Data integrity , Interviews , Visualization , Bars , Industries},
url = {https://eprints.whiterose.ac.uk/197083/},
abstract = {The use of good-quality data to inform decision making is entirely dependent on robust processes to ensure it is fit for purpose. Such processes vary between organisations, and between those tasked with designing and following them. In this paper we report on a survey of 53 data analysts from many industry sectors, 24 of whom also participated in in-depth interviews, about computational and visual methods for characterizing data and investigating data quality. The paper makes contributions in two key areas. The first is to data science fundamentals, because our lists of data profiling tasks and visualization techniques are more comprehensive than those published elsewhere. The second concerns the application question ?what does good profiling look like to those who routinely perform it?,? which we answer by highlighting the diversity of profiling tasks, unusual practice and exemplars of visualization, and recommendations about formalizing processes and creating rulebooks.}
}Contour trees are a significant tool for data analysis as they capture both local and global variation. However, their utility has been limited by scalability, in particular for distributed computation and storage. We report a distributed data structure for storing the contour tree of a data set distributed on a cluster, based on a fan-in hierarchy, and an algorithm for computing it based on the boundary tree that represents only the superarcs of a contour tree that involve contours that cross boundaries between blocks. This allows us to limit the communication cost for contour tree computation to the complexity of the block boundaries rather than of the entire data set.
@misc{wrro190963,
booktitle = {2022 IEEE 12th Symposium on Large Data Analysis and Visualization (LDAV)},
month = {December},
title = {Distributed Hierarchical Contour Trees},
author = {HA Carr and O R{\"u}bel and GH Weber},
publisher = {IEEE},
year = {2022},
journal = {2022 IEEE 12th Symposium on Large Data Analysis and Visualization (LDAV)},
url = {https://eprints.whiterose.ac.uk/190963/},
abstract = {Contour trees are a significant tool for data analysis as they capture both local and global variation. However, their utility has been limited by scalability, in particular for distributed computation and storage. We report a distributed data structure for storing the contour tree of a data set distributed on a cluster, based on a fan-in hierarchy, and an algorithm for computing it based on the boundary tree that represents only the superarcs of a contour tree that involve contours that cross boundaries between blocks. This allows us to limit the communication cost for contour tree computation to the complexity of the block boundaries rather than of the entire data set.}
}Background Structured Medication Reviews (SMRs) are intended to help deliver the NHS Long Term Plan for medicines optimisation in people living with multiple long-term conditions and polypharmacy. It is challenging to gather the information needed for these reviews due to poor integration of health records across providers and there is little guidance on how to identify those patients most urgently requiring review. Objective To extract information from scattered clinical records on how health and medications change over time, apply interpretable artificial intelligence (AI) approaches to predict risks of poor outcomes and overlay this information on care records to inform SMRs. We will pilot this approach in primary care prescribing audit and feedback systems, and co-design future medicines optimisation decision support systems. Design DynAIRx will target potentially problematic polypharmacy in three key multimorbidity groups, namely, people with (a) mental and physical health problems, (b) four or more long-term conditions taking ten or more drugs and (c) older age and frailty. Structured clinical data will be drawn from integrated care records (general practice, hospital, and social care) covering an {$\sim$}11m population supplemented with Natural Language Processing (NLP) of unstructured clinical text. AI systems will be trained to identify patterns of conditions, medications, tests, and clinical contacts preceding adverse events in order to identify individuals who might benefit most from an SMR. Discussion By implementing and evaluating an AI-augmented visualisation of care records in an existing prescribing audit and feedback system we will create a learning system for medicines optimisation, co-designed throughout with end-users and patients.
@article{wrro197084,
volume = {12},
month = {December},
author = {LE Walker and AS Abuzour and D Bollegala and A Clegg and M Gabbay and A Griffiths and C Kullu and G Leeming and FS Mair and S Maskell and S Relton and RA Ruddle and E Shantsila and M Sperrin and T Van Staa and A Woodall and I Buchan},
note = {{\copyright} The Author(s) 2022. This is an open access article under the terms of the Creative Commons Attribution License (CC-BY 4.0), which permits unrestricted use, distribution and reproduction in any medium, provided the original work is properly cited.},
title = {The DynAIRx Project Protocol: Artificial Intelligence for dynamic prescribing optimisation and care integration in multimorbidity},
publisher = {SAGE Publications},
year = {2022},
journal = {Journal of Multimorbidity and Comorbidity},
pages = {1--14},
keywords = {multimorbidity, polypharmacy, frailty, mental health, artificial intelligence, medicines optimisation},
url = {https://eprints.whiterose.ac.uk/197084/},
abstract = {Background
Structured Medication Reviews (SMRs) are intended to help deliver the NHS Long Term Plan for medicines optimisation in people living with multiple long-term conditions and polypharmacy. It is challenging to gather the information needed for these reviews due to poor integration of health records across providers and there is little guidance on how to identify those patients most urgently requiring review.
Objective
To extract information from scattered clinical records on how health and medications change over time, apply interpretable artificial intelligence (AI) approaches to predict risks of poor outcomes and overlay this information on care records to inform SMRs. We will pilot this approach in primary care prescribing audit and feedback systems, and co-design future medicines optimisation decision support systems.
Design
DynAIRx will target potentially problematic polypharmacy in three key multimorbidity groups, namely, people with (a) mental and physical health problems, (b) four or more long-term conditions taking ten or more drugs and (c) older age and frailty. Structured clinical data will be drawn from integrated care records (general practice, hospital, and social care) covering an {$\sim$}11m population supplemented with Natural Language Processing (NLP) of unstructured clinical text. AI systems will be trained to identify patterns of conditions, medications, tests, and clinical contacts preceding adverse events in order to identify individuals who might benefit most from an SMR.
Discussion
By implementing and evaluating an AI-augmented visualisation of care records in an existing prescribing audit and feedback system we will create a learning system for medicines optimisation, co-designed throughout with end-users and patients.}
}Existing studies on formation control for unmanned aerial vehicles (UAV) have not considered encircling targets where an optimum coverage of the target is required at all times. Such coverage plays a critical role in many real-world applications such as tracking hostile UAVs. This paper proposes a new path planning approach called the Flux Guided (FG) method, which generates collision-free trajectories for multiple UAVs while maximising the coverage of target(s). Our method enables UAVs to track directly toward a target whilst maintaining maximum coverage. Furthermore, multiple scattered targets can be tracked by scaling the formation during flight. FG is highly scalable since it only requires communication between sub-set of UAVs on the open boundary of the formation?s surface. Experimental results further validate that FG generates UAV trajectories shorter than previous work and that trajectory planning for 9 leader/follower UAVs to surround a target in two different scenarios only requires 0.52 s and 0.88 s, respectively. The resulting trajectories are suitable for robotic controls after time-optimal parameterisation; we demonstrate this using a 3d dynamic particle system that tracks the desired trajectories using a PID controller.
@article{wrro187452,
volume = {205},
month = {November},
author = {J Hartley and HPH Shum and ESL Ho and H Wang and S Ramamoorthy},
note = {{\copyright} 2022 The Author(s). Published by Elsevier Ltd. This is an open access article under the terms of the Creative Commons Attribution 4.0 International (CC BY 4.0)},
title = {Formation control for UAVs using a Flux Guided approach},
publisher = {Elsevier},
journal = {Expert Systems with Applications},
year = {2022},
keywords = {Unmanned aerial vehicles; Multi-agent motion planning; Formation encirclement; Artificial harmonic field; Electric flux},
url = {https://eprints.whiterose.ac.uk/187452/},
abstract = {Existing studies on formation control for unmanned aerial vehicles (UAV) have not considered encircling targets where an optimum coverage of the target is required at all times. Such coverage plays a critical role in many real-world applications such as tracking hostile UAVs. This paper proposes a new path planning approach called the Flux Guided (FG) method, which generates collision-free trajectories for multiple UAVs while maximising the coverage of target(s). Our method enables UAVs to track directly toward a target whilst maintaining maximum coverage. Furthermore, multiple scattered targets can be tracked by scaling the formation during flight. FG is highly scalable since it only requires communication between sub-set of UAVs on the open boundary of the formation?s surface. Experimental results further validate that FG generates UAV trajectories shorter than previous work and that trajectory planning for 9 leader/follower UAVs to surround a target in two different scenarios only requires 0.52 s and 0.88 s, respectively. The resulting trajectories are suitable for robotic controls after time-optimal parameterisation; we demonstrate this using a 3d dynamic particle system that tracks the desired trajectories using a PID controller.}
}Trajectory prediction has been widely pursued in many fields, and many model-based and model-free methods have been explored. The former include rule-based, geometric or optimization-based models, and the latter are mainly comprised of deep learning approaches. In this paper, we propose a new method combining both methodologies based on a new Neural Differential Equation model. Our new model (Neural Social Physics or NSP) is a deep neural network within which we use an explicit physics model with learnable parameters. The explicit physics model serves as a strong inductive bias in modeling pedestrian behaviors, while the rest of the network provides a strong data-fitting capability in terms of system parameter estimation and dynamics stochasticity modeling. We compare NSP with 15 recent deep learning methods on 6 datasets and improve the state-of-the-art performance by 5.56\%?70\%. Besides, we show that NSP has better generalizability in predicting plausible trajectories in drastically different scenarios where the density is 2?5 times as high as the testing data. Finally, we show that the physics model in NSP can provide plausible explanations for pedestrian behaviors, as opposed to black-box deep learning. Code is available: https://github.com/realcrane/Human-Trajectory-Prediction-via-Neural-Social-Physics.
@misc{wrro189355,
volume = {13694},
month = {October},
author = {J Yue and D Manocha and H Wang},
note = {{\copyright} 2022 The Author(s), under exclusive license to Springer Nature Switzerland AG. This is an author produced version of a conference paper published in Lecture Notes in Computer Science. Uploaded in accordance with the publisher's self-archiving policy.},
booktitle = {The European Conference on Computer Vision 2022},
title = {Human Trajectory Prediction via Neural Social Physics},
publisher = {Springer},
year = {2022},
journal = {Lecture Notes in Computer Science},
pages = {376--394},
keywords = {Human trajectory prediction; Neural differential equations},
url = {https://eprints.whiterose.ac.uk/189355/},
abstract = {Trajectory prediction has been widely pursued in many fields, and many model-based and model-free methods have been explored. The former include rule-based, geometric or optimization-based models, and the latter are mainly comprised of deep learning approaches. In this paper, we propose a new method combining both methodologies based on a new Neural Differential Equation model. Our new model (Neural Social Physics or NSP) is a deep neural network within which we use an explicit physics model with learnable parameters. The explicit physics model serves as a strong inductive bias in modeling pedestrian behaviors, while the rest of the network provides a strong data-fitting capability in terms of system parameter estimation and dynamics stochasticity modeling. We compare NSP with 15 recent deep learning methods on 6 datasets and improve the state-of-the-art performance by 5.56\%?70\%. Besides, we show that NSP has better generalizability in predicting plausible trajectories in drastically different scenarios where the density is 2?5 times as high as the testing data. Finally, we show that the physics model in NSP can provide plausible explanations for pedestrian behaviors, as opposed to black-box deep learning. Code is available: https://github.com/realcrane/Human-Trajectory-Prediction-via-Neural-Social-Physics.}
}We propose a novel method for generating high-resolution videos of talking-heads from speech audio and a single 'identity' image. Our method is based on a convolutional neural network model that incorporates a pre-trained StyleGAN generator. We model each frame as a point in the latent space of StyleGAN so that a video corresponds to a trajectory through the latent space. Training the network is in two stages. The first stage is to model trajectories in the latent space conditioned on speech utterances. To do this, we use an existing encoder to invert the generator, mapping from each video frame into the latent space. We train a recurrent neural network to map from speech utterances to displacements in the latent space of the image generator. These displacements are relative to the back-projection into the latent space of an identity image chosen from the individuals depicted in the training dataset. In the second stage, we improve the visual quality of the generated videos by tuning the image generator on a single image or a short video of any chosen identity. We evaluate our model on standard measures (PSNR, SSIM, FID and LMD) and show that it significantly outperforms recent state-of-the-art methods on one of two commonly used datasets and gives comparable performance on the other. Finally, we report on ablation experiments that validate the components of the model. The code and videos from experiments can be found at https://mohammedalghamdi.github.io/talking-heads-acm-mm/
@misc{wrro198157,
month = {October},
author = {MM Alghamdi and H Wang and AJ Bulpitt and DC Hogg},
note = {{\copyright} 2022 Copyright held by the owner/author(s). Publication rights licensed to ACM. This is an author produced version of an article published in Proceedings of the 30th ACM International Conference on Multimedia. Uploaded in accordance with the publisher's self-archiving policy.},
booktitle = {MM '22: The 30th ACM International Conference on Multimedia},
title = {Talking Head from Speech Audio using a Pre-trained Image Generator},
publisher = {ACM},
year = {2022},
journal = {Proceedings of the 30th ACM International Conference on Multimedia},
pages = {5228--5236},
url = {https://eprints.whiterose.ac.uk/198157/},
abstract = {We propose a novel method for generating high-resolution videos of talking-heads from speech audio and a single 'identity' image. Our method is based on a convolutional neural network model that incorporates a pre-trained StyleGAN generator. We model each frame as a point in the latent space of StyleGAN so that a video corresponds to a trajectory through the latent space. Training the network is in two stages. The first stage is to model trajectories in the latent space conditioned on speech utterances. To do this, we use an existing encoder to invert the generator, mapping from each video frame into the latent space. We train a recurrent neural network to map from speech utterances to displacements in the latent space of the image generator. These displacements are relative to the back-projection into the latent space of an identity image chosen from the individuals depicted in the training dataset. In the second stage, we improve the visual quality of the generated videos by tuning the image generator on a single image or a short video of any chosen identity. We evaluate our model on standard measures (PSNR, SSIM, FID and LMD) and show that it significantly outperforms recent state-of-the-art methods on one of two commonly used datasets and gives comparable performance on the other. Finally, we report on ablation experiments that validate the components of the model. The code and videos from experiments can be found at https://mohammedalghamdi.github.io/talking-heads-acm-mm/}
}Layout design is ubiquitous in many applications, e.g. architecture/urban planning, etc, which involves a lengthy iterative design process. Recently, deep learning has been leveraged to automatically generate layouts via image generation, showing a huge potential to free designers from laborious routines. While automatic generation can greatly boost productivity, designer input is undoubtedly crucial. An ideal AI-aided design tool should automate repetitive routines, and meanwhile accept human guidance and provide smart/proactive suggestions. However, the capability of involving humans into the loop has been largely ignored in existing methods which are mostly end-to-end approaches. To this end, we propose a new human-in-the-loop generative model, iPLAN, which is capable of automatically generating layouts, but also interacting with designers throughout the whole procedure, enabling humans and AI to co-evolve a sketchy idea gradually into the final design. iPLAN is evaluated on diverse datasets and compared with existing methods. The results show that iPLAN has high fidelity in producing similar layouts to those from human designers, great flexibility in accepting designer inputs and providing design suggestions accordingly, and strong generalizability when facing unseen design tasks and limited training data.
@misc{wrro185289,
month = {September},
author = {F He and Y Huang and H Wang},
note = {Personal use of this material is permitted. Permission from IEEE must be obtained for all other uses, in any current or future media, including reprinting/republishing this material for advertising or promotional purposes, creating new collective works, for resale or redistribution to servers or lists, or reuse of any copyrighted component of this work in other works.},
booktitle = {IEEE/CVF Conference on Computer Vision and Pattern Recognition (CVPR) 2022},
title = {iPLAN: Interactive and Procedural Layout Planning},
publisher = {IEEE},
year = {2022},
journal = {2022 IEEE/CVF Conference on Computer Vision and Pattern Recognition (CVPR)},
pages = {7783--7792},
keywords = {Productivity, Image synthesis, Layout, Training data, Human in the loop, Planning, Pattern recognition},
url = {https://eprints.whiterose.ac.uk/185289/},
abstract = {Layout design is ubiquitous in many applications, e.g. architecture/urban planning, etc, which involves a lengthy iterative design process. Recently, deep learning has been leveraged to automatically generate layouts via image generation, showing a huge potential to free designers from laborious routines. While automatic generation can greatly boost productivity, designer input is undoubtedly crucial. An ideal AI-aided design tool should automate repetitive routines, and meanwhile accept human guidance and provide smart/proactive suggestions. However, the capability of involving humans into the loop has been largely ignored in existing methods which are mostly end-to-end approaches. To this end, we propose a new human-in-the-loop generative model, iPLAN, which is capable of automatically generating layouts, but also interacting with designers throughout the whole procedure, enabling humans and AI to co-evolve a sketchy idea gradually into the final design. iPLAN is evaluated on diverse datasets and compared with existing methods. The results show that iPLAN has high fidelity in producing similar layouts to those from human designers, great flexibility in accepting designer inputs and providing design suggestions accordingly, and strong generalizability when facing unseen design tasks and limited training data.}
}Real-time in-between motion generation is universally required in games and highly desirable in existing animation pipelines. Its core challenge lies in the need to satisfy three critical conditions simultaneously: quality, controllability and speed, which renders any methods that need offline computation (or post-processing) or cannot incorporate (often unpredictable) user control undesirable. To this end, we propose a new real-time transition method to address the aforementioned challenges. Our approach consists of two key components: motion manifold and conditional transitioning. The former learns the important low-level motion features and their dynamics; while the latter synthesizes transitions conditioned on a target frame and the desired transition duration. We first learn a motion manifold that explicitly models the intrinsic transition stochasticity in human motions via a multi-modal mapping mechanism. Then, during generation, we design a transition model which is essentially a sampling strategy to sample from the learned manifold, based on the target frame and the aimed transition duration. We validate our method on different datasets in tasks where no post-processing or offline computation is allowed. Through exhaustive evaluation and comparison, we show that our method is able to generate high-quality motions measured under multiple metrics. Our method is also robust under various target frames (with extreme cases).
@article{wrro186288,
volume = {41},
number = {4},
month = {July},
author = {X Tang and H Wang and B Hu and X Gong and R Yi and Q Kou and X Jin},
title = {Real-time controllable motion transition for characters},
publisher = {Association for Computing Machinery (ACM)},
journal = {ACM Transactions on Graphics},
year = {2022},
keywords = {in-betweening, real-time, animation, motion manifold, deep learning, conditional transitioning, locomotion},
url = {https://eprints.whiterose.ac.uk/186288/},
abstract = {Real-time in-between motion generation is universally required in games and highly desirable in existing animation pipelines. Its core challenge lies in the need to satisfy three critical conditions simultaneously: quality, controllability and speed, which renders any methods that need offline computation (or post-processing) or cannot incorporate (often unpredictable) user control undesirable. To this end, we propose a new real-time transition method to address the aforementioned challenges. Our approach consists of two key components: motion manifold and conditional transitioning. The former learns the important low-level motion features and their dynamics; while the latter synthesizes transitions conditioned on a target frame and the desired transition duration. We first learn a motion manifold that explicitly models the intrinsic transition stochasticity in human motions via a multi-modal mapping mechanism. Then, during generation, we design a transition model which is essentially a sampling strategy to sample from the learned manifold, based on the target frame and the aimed transition duration. We validate our method on different datasets in tasks where no post-processing or offline computation is allowed. Through exhaustive evaluation and comparison, we show that our method is able to generate high-quality motions measured under multiple metrics. Our method is also robust under various target frames (with extreme cases).}
}Pleckstrin homology (PH) domains can recruit proteins to membranes by recognition of phosphatidylinositol phosphate (PIP) lipids. Several family members are linked to diseases including cancer. We report the systematic simulation of the interactions of 100 mammalian PH domains with PIP-containing membranes. The observed PIP interaction hotspots recapitulate crystallographic binding sites and reveal a number of insights: (i) The {\ensuremath{\beta}}1 and {\ensuremath{\beta}}2 strands and their connecting loop constitute the primary PIP interaction site but are typically supplemented by interactions at the {\ensuremath{\beta}}3-{\ensuremath{\beta}}4 and {\ensuremath{\beta}}5-{\ensuremath{\beta}}6 loops; (ii) we reveal exceptional cases such as the Exoc8 PH domain; (iii) PH domains adopt different membrane-bound orientations and induce clustering of anionic lipids; and (iv) beyond family-level insights, our dataset sheds new light on individual PH domains, e.g., by providing molecular detail of secondary PIP binding sites. This work provides a global view of PH domain/membrane association involving multivalent association with anionic lipids.
@article{wrro186303,
volume = {8},
number = {27},
month = {July},
author = {KIP Le Huray and H Wang and F Sobott and A Kalli},
note = {{\copyright} 2022 The Authors, some rights reserved; exclusive licensee American Association for the Advancement of Science.
This is an open access article under the terms of the Creative Commons Attribution License (CC-BY 4.0), which permits unrestricted use, distribution and reproduction in any medium, provided the original work is properly cited.},
title = {Systematic simulation of the interactions of Pleckstrin homology domains with membranes},
publisher = {American Association for the Advancement of Science},
year = {2022},
journal = {Science Advances},
url = {https://eprints.whiterose.ac.uk/186303/},
abstract = {Pleckstrin homology (PH) domains can recruit proteins to membranes by recognition of phosphatidylinositol phosphate (PIP) lipids. Several family members are linked to diseases including cancer. We report the systematic simulation of the interactions of 100 mammalian PH domains with PIP-containing membranes. The observed PIP interaction hotspots recapitulate crystallographic binding sites and reveal a number of insights: (i) The {\ensuremath{\beta}}1 and {\ensuremath{\beta}}2 strands and their connecting loop constitute the primary PIP interaction site but are typically supplemented by interactions at the {\ensuremath{\beta}}3-{\ensuremath{\beta}}4 and {\ensuremath{\beta}}5-{\ensuremath{\beta}}6 loops; (ii) we reveal exceptional cases such as the Exoc8 PH domain; (iii) PH domains adopt different membrane-bound orientations and induce clustering of anionic lipids; and (iv) beyond family-level insights, our dataset sheds new light on individual PH domains, e.g., by providing molecular detail of secondary PIP binding sites. This work provides a global view of PH domain/membrane association involving multivalent association with anionic lipids.}
}Generating new images with desired properties (e.g. new view/poses) from source images has been enthusiastically pursued recently, due to its wide range of potential applications. One way to ensure high-quality generation is to use multiple sources with complementary information such as different views of the same object. However, as source images are often misaligned due to the large disparities among the camera settings, strong assumptions have been made in the past with respect to the camera(s) or/and the object in interest, limiting the application of such techniques. Therefore, we propose a new general approach which models multiple types of variations among sources, such as view angles, poses, facial expressions, in a unified framework, so that it can be employed on datasets of vastly different nature. We verify our approach on a variety of data including humans bodies, faces, city scenes and 3D objects. Both the qualitative and quantitative results demonstrate the better performance of our method than the state of the art.
@misc{wrro182434,
volume = {36},
number = {2},
month = {June},
author = {J Lu and H Wang and T Shao and Y Yang and K Zhou},
note = {{\copyright} 2022, Association for the Advancement of Artificial Intelligence (www.aaai.org). All rights reserved. This is an author produced version of a conference paper published in Proceedings of the AAAI Conference on Artificial Intelligence. Uploaded in accordance with the publisher's self-archiving policy.},
booktitle = {36th AAAI Conference on Artificial Intelligence},
title = {Pose Guided Image Generation from Misaligned Sources via Residual Flow Based Correction},
publisher = {AAAI},
year = {2022},
journal = {Proceedings of the AAAI Conference on Artificial Intelligence},
pages = {1863--1871},
url = {https://eprints.whiterose.ac.uk/182434/},
abstract = {Generating new images with desired properties (e.g. new view/poses) from source images has been enthusiastically pursued recently, due to its wide range of potential applications. One way to ensure high-quality generation is to use multiple sources with complementary information such as different views of the same object. However, as source images are often misaligned due to the large disparities among the camera settings, strong assumptions have been made in the past with respect to the camera(s) or/and the object in interest, limiting the application of such techniques. Therefore, we propose a new general approach which models multiple types of variations among sources, such as view angles, poses, facial expressions, in a unified framework, so that it can be employed on datasets of vastly different nature. We verify our approach on a variety of data including humans bodies, faces, city scenes and 3D objects. Both the qualitative and quantitative results demonstrate the better performance of our method than the state of the art.}
}Automatic container handling plays an important role in improving the efficiency of the container terminal, promoting the globalization of container trade, and ensuring worker safety. Utilizing vision-based methods to assist container handling has recently drawn attention. However, most existing keyhole detection/localization methods still suffer from coarse keyhole boundaries. To solve this problem, we propose a real-time container hole localization algorithm based on a modified salient object segmentation network. Note that there exists no public container dataset for researchers to fairly compare their approaches, which has hindered the advances of related algorithms in this domain. Therefore, we propose the first large-scale container dataset in this work, containing 1700 container images and 4810 container hole images, for benchmarking container hole location and detection. Through extensive quantitative evaluation and computational complexity analysis, we show our method can simultaneously achieve superior results on precision and real-time performance. Especially, the detection and location precision is 100\% and 99.3\%, surpassing the state-of-the-art-work by 2\% and 62\% respectively. Further, our proposed method only consumes 70 ms (on GPU) or 1.27s (on CPU) per image. We hope the baseline approach, the first released dataset will help benchmark future work and follow-up research on automatic container handling. The dataset is available at https://github.com/qkicen/A-large-scale-container-dataset-and-a-baseline-method-for-container-hole-localization.
@article{wrro185339,
volume = {19},
number = {3},
month = {June},
author = {Y Diao and X Tang and H Wang and ECF Taylor and S Xiao and M Xie and W Cheng},
note = {{\copyright} The Author(s), under exclusive licence to Springer-Verlag GmbH Germany, part of Springer Nature 2022. This version of the article has been accepted for publication, after peer review (when applicable) and is subject to Springer Nature?s AM terms of use, but is not the Version of Record and does not reflect post-acceptance improvements, or any corrections. The Version of Record is available online at: https://doi.org/10.1007/s11554-022-01199-y. Uploaded in accordance with the publisher's self-archiving policy.},
title = {A large-scale container dataset and a baseline method for container hole localization},
publisher = {Springer},
year = {2022},
journal = {Journal of Real-Time Image Processing},
pages = {577--589},
keywords = {Container keyhole localization; Salient object segmentation; Deep learning; Container dataset},
url = {https://eprints.whiterose.ac.uk/185339/},
abstract = {Automatic container handling plays an important role in improving the efficiency of the container terminal, promoting the globalization of container trade, and ensuring worker safety. Utilizing vision-based methods to assist container handling has recently drawn attention. However, most existing keyhole detection/localization methods still suffer from coarse keyhole boundaries. To solve this problem, we propose a real-time container hole localization algorithm based on a modified salient object segmentation network. Note that there exists no public container dataset for researchers to fairly compare their approaches, which has hindered the advances of related algorithms in this domain. Therefore, we propose the first large-scale container dataset in this work, containing 1700 container images and 4810 container hole images, for benchmarking container hole location and detection. Through extensive quantitative evaluation and computational complexity analysis, we show our method can simultaneously achieve superior results on precision and real-time performance. Especially, the detection and location precision is 100\% and 99.3\%, surpassing the state-of-the-art-work by 2\% and 62\% respectively. Further, our proposed method only consumes 70 ms (on GPU) or 1.27s (on CPU) per image. We hope the baseline approach, the first released dataset will help benchmark future work and follow-up research on automatic container handling. The dataset is available at https://github.com/qkicen/A-large-scale-container-dataset-and-a-baseline-method-for-container-hole-localization.}
}Screen-space ambient occlusion (SSAO) shows high efficiency and is widely used in real-time 3D applications. However, using SSAO algorithms in stereo rendering can lead to inconsistencies due to the differences in the screen-space information captured by the left and right eye. This will affect the perception of the scene and may be a source of viewer discomfort. In this paper, we show that the raw obscurance estimation part and subsequent filtering are both sources of inconsistencies. We developed a screen-space method involving both views in conjunction, leading to a stereo-aware raw obscurance estimation method and a stereo-aware bilateral filter. The results show that our method reduces stereo inconsistencies to a level comparable to geometry-based AO solutions, while maintaining the performance benefits of a screen-space approach.
@article{wrro187713,
volume = {5},
number = {1},
month = {May},
author = {P Shi and M Billeter and E Eisemann},
note = {{\copyright} 2022 Copyright held by the owner/author(s). This is an open access article under the terms of the Creative Commons Attribution-ShareAlike 4.0 International (CC BY-SA 4.0)},
title = {Stereo-consistent screen-space ambient occlusion},
publisher = {Association for Computing Machinery (ACM)},
doi = {10.1145/3522614},
year = {2022},
journal = {Proceedings of the ACM on computer graphics and interactive techniques},
keywords = {screen-space ambient occlusion; stereo consistency; VR},
url = {https://eprints.whiterose.ac.uk/187713/},
abstract = {Screen-space ambient occlusion (SSAO) shows high efficiency and is widely used in real-time 3D applications. However, using SSAO algorithms in stereo rendering can lead to inconsistencies due to the differences in the screen-space information captured by the left and right eye. This will affect the perception of the scene and may be a source of viewer discomfort. In this paper, we show that the raw obscurance estimation part and subsequent filtering are both sources of inconsistencies. We developed a screen-space method involving both views in conjunction, leading to a stereo-aware raw obscurance estimation method and a stereo-aware bilateral filter. The results show that our method reduces stereo inconsistencies to a level comparable to geometry-based AO solutions, while maintaining the performance benefits of a screen-space approach.}
}Numerical simulations of groundwater flow are used to analyze and predict the response of an aquifer system to its change in state by approximating the solution of the fundamental groundwater physical equations. The most used and classical methodologies, such as Finite Difference (FD) and Finite Element (FE) Methods, use iterative solvers which are associated with high computational cost. This study proposes a physics-based convolutional encoder-decoder neural network as a surrogate model to quickly calculate the response of the groundwater system. Holding strong promise in cross-domain mappings, encoder-decoder networks are applicable for learning complex input-output mappings of physical systems. This manuscript presents an Attention U-Net model that attempts to capture the fundamental input-output relations of the groundwater system and generates solutions of hydraulic head in the whole domain given a set of physical parameters and boundary conditions. The model accurately predicts the steady state response of a highly heterogeneous groundwater system given the locations and piezometric head of up to 3 wells as input. The network learns to pay attention only in the relevant parts of the domain and the generated hydraulic head field corresponds to the target samples in great detail. Even relative to coarse finite difference approximations the proposed model is shown to be significantly faster than a comparative state-of-the-art numerical solver, thus providing a base for further development of the presented networks as surrogate models for groundwater prediction.
@article{wrro185207,
volume = {163},
month = {May},
author = {ML Taccari and J Nuttall and X Chen and H Wang and B Minnema and PK Jimack},
note = {{\copyright} 2022 Elsevier Ltd. All rights reserved. This is an author produced version of an article published in Advances in Water Resources. Uploaded in accordance with the publisher's self-archiving policy.},
title = {Attention U-Net as a surrogate model for groundwater prediction},
publisher = {Elsevier},
journal = {Advances in Water Resources},
year = {2022},
keywords = {Attention U-Net; groundwater flow; image-to-image regression; Surrogate modelling},
url = {https://eprints.whiterose.ac.uk/185207/},
abstract = {Numerical simulations of groundwater flow are used to analyze and predict the response of an aquifer system to its change in state by approximating the solution of the fundamental groundwater physical equations. The most used and classical methodologies, such as Finite Difference (FD) and Finite Element (FE) Methods, use iterative solvers which are associated with high computational cost. This study proposes a physics-based convolutional encoder-decoder neural network as a surrogate model to quickly calculate the response of the groundwater system. Holding strong promise in cross-domain mappings, encoder-decoder networks are applicable for learning complex input-output mappings of physical systems. This manuscript presents an Attention U-Net model that attempts to capture the fundamental input-output relations of the groundwater system and generates solutions of hydraulic head in the whole domain given a set of physical parameters and boundary conditions. The model accurately predicts the steady state response of a highly heterogeneous groundwater system given the locations and piezometric head of up to 3 wells as input. The network learns to pay attention only in the relevant parts of the domain and the generated hydraulic head field corresponds to the target samples in great detail. Even relative to coarse finite difference approximations the proposed model is shown to be significantly faster than a comparative state-of-the-art numerical solver, thus providing a base for further development of the presented networks as surrogate models for groundwater prediction.}
}Background National audits aim to reduce variations in quality by stimulating quality improvement. However, varying provider engagement with audit data means that this is not being realised. Aim The aim of the study was to develop and evaluate a quality dashboard (i.e. QualDash) to support clinical teams? and managers? use of national audit data. Design The study was a realist evaluation and biography of artefacts study. Setting The study involved five NHS acute trusts. Methods and results In phase 1, we developed a theory of national audits through interviews. Data use was supported by data access, audit staff skilled to produce data visualisations, data timeliness and quality, and the importance of perceived metrics. Data were mainly used by clinical teams. Organisational-level staff questioned the legitimacy of national audits. In phase 2, QualDash was co-designed and the QualDash theory was developed. QualDash provides interactive customisable visualisations to enable the exploration of relationships between variables. Locating QualDash on site servers gave users control of data upload frequency. In phase 3, we developed an adoption strategy through focus groups. ?Champions?, awareness-raising through e-bulletins and demonstrations, and quick reference tools were agreed. In phase 4, we tested the QualDash theory using a mixed-methods evaluation. Constraints on use were metric configurations that did not match users? expectations, affecting champions? willingness to promote QualDash, and limited computing resources. Easy customisability supported use. The greatest use was where data use was previously constrained. In these contexts, report preparation time was reduced and efforts to improve data quality were supported, although the interrupted time series analysis did not show improved data quality. Twenty-three questionnaires were returned, revealing positive perceptions of ease of use and usefulness. In phase 5, the feasibility of conducting a cluster randomised controlled trial of QualDash was assessed. Interviews were undertaken to understand how QualDash could be revised to support a region-wide Gold Command. Requirements included multiple real-time data sources and functionality to help to identify priorities. Conclusions Audits seeking to widen engagement may find the following strategies beneficial: involving a range of professional groups in choosing metrics; real-time reporting; presenting ?headline? metrics important to organisational-level staff; using routinely collected clinical data to populate data fields; and dashboards that help staff to explore and report audit data. Those designing dashboards may find it beneficial to include the following: ?at a glance? visualisation of key metrics; visualisations configured in line with existing visualisations that teams use, with clear labelling; functionality that supports the creation of reports and presentations; the ability to explore relationships between variables and drill down to look at subgroups; and low requirements for computing resources. Organisations introducing a dashboard may find the following strategies beneficial: clinical champion to promote use; testing with real data by audit staff; establishing routines for integrating use into work practices; involving audit staff in adoption activities; and allowing customisation. Limitations The COVID-19 pandemic stopped phase 4 data collection, limiting our ability to further test and refine the QualDash theory. Questionnaire results should be treated with caution because of the small, possibly biased, sample. Control sites for the interrupted time series analysis were not possible because of research and development delays. One intervention site did not submit data. Limited uptake meant that assessing the impact on more measures was not appropriate. Future work The extent to which national audit dashboards are used and the strategies national audits use to encourage uptake, a realist review of the impact of dashboards, and rigorous evaluations of the impact of dashboards and the effectiveness of adoption strategies should be explored. Study registration This study is registered as ISRCTN18289782. Funding This project was funded by the National Institute for Health and Care Research (NIHR) Health and Social Care Delivery Research programme and will be published in full in Health and Social Care Delivery Research; Vol. 10, No. 12. See the NIHR Journals Library website for further project information.
@article{wrro188565,
volume = {10},
number = {12},
month = {May},
author = {R Randell and N Alvarado and M Elshehaly and L McVey and RM West and P Doherty and D Dowding and AJ Farrin and RG Feltbower and CP Gale and J Greenhalgh and J Lake and M Mamas and R Walwyn and RA Ruddle},
note = {{\copyright} 2022 Randell et al. This is an open access article under the terms of the Creative Commons Attribution 4.0 International License (CC BY 4.0) (https://creativecommons.org/licenses/by/4.0/)},
title = {Design and evaluation of an interactive quality dashboard for national clinical audit data: a realist evaluation},
publisher = {NIHR Journals Library},
year = {2022},
journal = {Health and Social Care Delivery Research},
url = {https://eprints.whiterose.ac.uk/188565/},
abstract = {Background
National audits aim to reduce variations in quality by stimulating quality improvement. However, varying provider engagement with audit data means that this is not being realised.
Aim
The aim of the study was to develop and evaluate a quality dashboard (i.e. QualDash) to support clinical teams? and managers? use of national audit data.
Design
The study was a realist evaluation and biography of artefacts study.
Setting
The study involved five NHS acute trusts.
Methods and results
In phase 1, we developed a theory of national audits through interviews. Data use was supported by data access, audit staff skilled to produce data visualisations, data timeliness and quality, and the importance of perceived metrics. Data were mainly used by clinical teams. Organisational-level staff questioned the legitimacy of national audits. In phase 2, QualDash was co-designed and the QualDash theory was developed. QualDash provides interactive customisable visualisations to enable the exploration of relationships between variables. Locating QualDash on site servers gave users control of data upload frequency. In phase 3, we developed an adoption strategy through focus groups. ?Champions?, awareness-raising through e-bulletins and demonstrations, and quick reference tools were agreed. In phase 4, we tested the QualDash theory using a mixed-methods evaluation. Constraints on use were metric configurations that did not match users? expectations, affecting champions? willingness to promote QualDash, and limited computing resources. Easy customisability supported use. The greatest use was where data use was previously constrained. In these contexts, report preparation time was reduced and efforts to improve data quality were supported, although the interrupted time series analysis did not show improved data quality. Twenty-three questionnaires were returned, revealing positive perceptions of ease of use and usefulness. In phase 5, the feasibility of conducting a cluster randomised controlled trial of QualDash was assessed. Interviews were undertaken to understand how QualDash could be revised to support a region-wide Gold Command. Requirements included multiple real-time data sources and functionality to help to identify priorities.
Conclusions
Audits seeking to widen engagement may find the following strategies beneficial: involving a range of professional groups in choosing metrics; real-time reporting; presenting ?headline? metrics important to organisational-level staff; using routinely collected clinical data to populate data fields; and dashboards that help staff to explore and report audit data. Those designing dashboards may find it beneficial to include the following: ?at a glance? visualisation of key metrics; visualisations configured in line with existing visualisations that teams use, with clear labelling; functionality that supports the creation of reports and presentations; the ability to explore relationships between variables and drill down to look at subgroups; and low requirements for computing resources. Organisations introducing a dashboard may find the following strategies beneficial: clinical champion to promote use; testing with real data by audit staff; establishing routines for integrating use into work practices; involving audit staff in adoption activities; and allowing customisation.
Limitations
The COVID-19 pandemic stopped phase 4 data collection, limiting our ability to further test and refine the QualDash theory. Questionnaire results should be treated with caution because of the small, possibly biased, sample. Control sites for the interrupted time series analysis were not possible because of research and development delays. One intervention site did not submit data. Limited uptake meant that assessing the impact on more measures was not appropriate.
Future work
The extent to which national audit dashboards are used and the strategies national audits use to encourage uptake, a realist review of the impact of dashboards, and rigorous evaluations of the impact of dashboards and the effectiveness of adoption strategies should be explored.
Study registration
This study is registered as ISRCTN18289782.
Funding
This project was funded by the National Institute for Health and Care Research (NIHR) Health and Social Care Delivery Research programme and will be published in full in Health and Social Care Delivery Research; Vol. 10, No. 12. See the NIHR Journals Library website for further project information.}
}Differentiable physics modeling combines physics models with gradient-based learning to provide model explicability and data efficiency. It has been used to learn dynamics, solve inverse problems and facilitate design, and is at its inception of impact. Current successes have concentrated on general physics models such as rigid bodies, deformable sheets, etc, assuming relatively simple structures and forces. Their granularity is intrinsically coarse and therefore incapable of modelling complex physical phenomena. Fine-grained models are still to be developed to incorporate sophisticated material structures and force interactions with gradient-based learning. Following this motivation, we propose a new differentiable fabrics model for composite materials such as cloths, where we dive into the granularity of yarns and model individual yarn physics and yarn-to-yarn interactions. To this end, we propose several differentiable forces, whose counterparts in empirical physics are indifferentiable, to facilitate gradient-based learning. These forces, albeit applied to cloths, are ubiquitous in various physical systems. Through comprehensive evaluation and comparison, we demonstrate our model?s explicability in learning meaningful physical parameters, versatility in incorporating complex physical structures and heterogeneous materials, data-efficiency in learning, and high-fidelity in capturing subtle dynamics.
@misc{wrro184059,
booktitle = {International Conference on Learning Representation 2022},
month = {April},
title = {Fine-grained differentiable physics: a yarn-level model for fabrics},
author = {D Gong and Z Zhu and A Bulpitt and H Wang},
publisher = {OpenReview.net},
year = {2022},
journal = {International Conference on Learning Representation},
url = {https://eprints.whiterose.ac.uk/184059/},
abstract = {Differentiable physics modeling combines physics models with gradient-based
learning to provide model explicability and data efficiency. It has been used to
learn dynamics, solve inverse problems and facilitate design, and is at its inception of impact. Current successes have concentrated on general physics models
such as rigid bodies, deformable sheets, etc, assuming relatively simple structures and forces. Their granularity is intrinsically coarse and therefore incapable
of modelling complex physical phenomena. Fine-grained models are still to be
developed to incorporate sophisticated material structures and force interactions
with gradient-based learning. Following this motivation, we propose a new differentiable fabrics model for composite materials such as cloths, where we dive
into the granularity of yarns and model individual yarn physics and yarn-to-yarn
interactions. To this end, we propose several differentiable forces, whose counterparts in empirical physics are indifferentiable, to facilitate gradient-based learning.
These forces, albeit applied to cloths, are ubiquitous in various physical systems.
Through comprehensive evaluation and comparison, we demonstrate our model?s
explicability in learning meaningful physical parameters, versatility in incorporating complex physical structures and heterogeneous materials, data-efficiency
in learning, and high-fidelity in capturing subtle dynamics.}
}Image generation has been heavily investigated in computer vision, where one core research challenge is to generate images from arbitrarily complex distributions with little supervision. Generative Adversarial Networks (GANs) as an implicit approach have achieved great successes in this direction and therefore been employed widely. However, GANs are known to suffer from issues such as mode collapse, non-structured latent space, being unable to compute likelihoods, etc. In this paper, we propose a new unsupervised non-parametric method named mixture of infinite conditional GANs or MIC-GANs, to tackle several GAN issues together, aiming for image generation with parsimonious prior knowledge. Through comprehensive evaluations across different datasets, we show that MIC-GANs are effective in structuring the latent space and avoiding mode collapse, and outperform state-of-the-art methods. MICGANs are adaptive, versatile, and robust. They offer a promising solution to several well-known GAN issues. Code available:github.com/yinghdb/MICGANs.
@misc{wrro177274,
month = {February},
author = {H Ying and H Wang and T Shao and Y Yang and K Zhou},
note = {{\copyright} 2021 IEEE. Permission from IEEE must be obtained for all other uses, in any current or future media, including reprinting/republishing this material for advertising or promotional purposes, creating new collective works, for resale or redistribution to servers or lists, or reuse of any copyrighted component of this work in other works. Uploaded in accordance with the publisher's self-archiving policy.},
booktitle = {2021 IEEE/CVF International Conference on Computer Vision (ICCV 2021)},
title = {Unsupervised Image Generation with Infinite Generative Adversarial Networks},
journal = {2021 IEEE/CVF International Conference on Computer Vision (ICCV)},
pages = {14264--14273},
year = {2022},
keywords = {Image and video synthesis; Machine learning architectures and formulations},
url = {https://eprints.whiterose.ac.uk/177274/},
abstract = {Image generation has been heavily investigated in computer vision, where one core research challenge is to generate images from arbitrarily complex distributions with little supervision. Generative Adversarial Networks (GANs) as an implicit approach have achieved great successes in this direction and therefore been employed widely. However, GANs are known to suffer from issues such as mode collapse, non-structured latent space, being unable to compute likelihoods, etc. In this paper, we propose a new unsupervised non-parametric method named mixture of infinite conditional GANs or MIC-GANs, to tackle several GAN issues together, aiming for image generation with parsimonious prior knowledge. Through comprehensive evaluations across different datasets, we show that MIC-GANs are effective in structuring the latent space and avoiding mode collapse, and outperform state-of-the-art methods. MICGANs are adaptive, versatile, and robust. They offer a promising solution to several well-known GAN issues. Code available:github.com/yinghdb/MICGANs.}
}Many spatial filtering methods have been proposed to enhance the target identification performance for the steady-state visual evoked potential (SSVEP)-based brain?computer interface (BCI). The existing approaches tend to learn spatial filter parameters of a certain target using only the training data from the same stimulus, and they rarely consider the information from other stimuli or the volume conduction problem during the training process. In this article, we propose a novel multi-objective optimization-based high-pass spatial filtering method to improve the SSVEP detection accuracy and robustness. The filters are derived via maximizing the correlation between the training signal and the individual template from the same target whilst minimizing the correlation between the signal from other targets and the template. The optimization will also be subject to the constraint that the sum of filter elements is zero. The evaluation study on two self-collected SSVEP datasets (including 12 and four frequencies, respectively) shows that the proposed method outperformed the compared methods such as canonical correlation analysis (CCA), multiset CCA (MsetCCA), sum of squared correlations (SSCOR), and task-related component analysis (TRCA). The proposed method was also verified on a public 40-class SSVEP benchmark dataset recorded from 35 subjects. The experimental results have demonstrated the effectiveness of the proposed approach for enhancing the SSVEP detection performance.
@article{wrro182567,
volume = {71},
month = {January},
author = {Y Zhang and Z Li and SQ Xie and H Wang and Z Yu and Z Zhang},
note = {{\copyright} 2022 IEEE. Personal use of this material is permitted. Permission from IEEE must be obtained for all other uses, in any current or future media, including reprinting/republishing this material for advertising or promotional purposes, creating new collective works, for resale or redistribution to servers or lists, or reuse of any copyrighted component of this work in other works.},
title = {Multi-Objective Optimization-Based High-Pass Spatial Filtering for SSVEP-Based Brain?Computer Interfaces},
publisher = {IEEE},
journal = {IEEE Transactions on Instrumentation and Measurement},
year = {2022},
keywords = {Brain?computer interface (BCI), electroencephalography (EEG), high-pass spatial filter, multi-objective optimization, steady-state visual evoked potential (SSVEP)},
url = {https://eprints.whiterose.ac.uk/182567/},
abstract = {Many spatial filtering methods have been proposed to enhance the target identification performance for the steady-state visual evoked potential (SSVEP)-based brain?computer interface (BCI). The existing approaches tend to learn spatial filter parameters of a certain target using only the training data from the same stimulus, and they rarely consider the information from other stimuli or the volume conduction problem during the training process. In this article, we propose a novel multi-objective optimization-based high-pass spatial filtering method to improve the SSVEP detection accuracy and robustness. The filters are derived via maximizing the correlation between the training signal and the individual template from the same target whilst minimizing the correlation between the signal from other targets and the template. The optimization will also be subject to the constraint that the sum of filter elements is zero. The evaluation study on two self-collected SSVEP datasets (including 12 and four frequencies, respectively) shows that the proposed method outperformed the compared methods such as canonical correlation analysis (CCA), multiset CCA (MsetCCA), sum of squared correlations (SSCOR), and task-related component analysis (TRCA). The proposed method was also verified on a public 40-class SSVEP benchmark dataset recorded from 35 subjects. The experimental results have demonstrated the effectiveness of the proposed approach for enhancing the SSVEP detection performance.}
}Action recognition has been heavily employed in many applications such as autonomous vehicles, surveillance, etc, where its robustness is a primary concern. In this paper, we examine the robustness of state-of-the-art action recognizers against adversarial attack, which has been rarely investigated so far. To this end, we propose a new method to attack action recognizers which rely on the 3D skeletal motion. Our method involves an innovative perceptual loss which ensures the imperceptibility of the attack. Empirical studies demonstrate that our method is effective in both white-box and black-box scenarios. Its generalizability is evidenced on a variety of action recognizers and datasets. Its versatility is shown in different attacking strategies. Its deceitfulness is proven in extensive perceptual studies. Our method shows that adversarial attack on 3D skeletal motions, one type of time-series data, is significantly different from traditional adversarial attack problems. Its success raises serious concern on the robustness of action recognizers and provides insights on potential improvements.
@misc{wrro171784,
month = {November},
author = {H Wang and F He and Z Peng and T Shao and Y-L Yang and K Zhou and D Hogg},
note = {{\copyright}2021 IEEE. Personal use of this material is permitted. Permission from IEEE must be obtained for all other uses, in any current or future media, including reprinting/republishing this material for advertising or promotional purposes, creating new collective works, for resale or redistribution to servers or lists, or reuse of any copyrighted component of this work in other works.},
booktitle = {2021 IEEE/CVF Conference on Computer Vision and Pattern Recognition (CVPR)},
title = {Understanding the Robustness of Skeleton-based Action Recognition under Adversarial Attack},
publisher = {IEEE},
year = {2021},
journal = {2021 IEEE/CVF Conference on Computer Vision and Pattern Recognition (CVPR)},
pages = {14651--14660},
url = {https://eprints.whiterose.ac.uk/171784/},
abstract = {Action recognition has been heavily employed in many applications such as autonomous vehicles, surveillance, etc, where its robustness is a primary concern. In this paper, we examine the robustness of state-of-the-art action recognizers against adversarial attack, which has been rarely investigated so far. To this end, we propose a new method to attack action recognizers which rely on the 3D skeletal motion. Our method involves an innovative perceptual loss which ensures the imperceptibility of the attack. Empirical studies demonstrate that our method is effective in both white-box and black-box scenarios. Its generalizability is evidenced on a variety of action recognizers and datasets. Its versatility is shown in different attacking strategies. Its deceitfulness is proven in extensive perceptual studies. Our method shows that adversarial attack on 3D skeletal motions, one type of time-series data, is significantly different from traditional adversarial attack problems. Its success raises serious concern on the robustness of action recognizers and provides insights on potential improvements.}
}Background: Dashboards can support data-driven quality improvements in health care. They visualize data in ways intended to ease cognitive load and support data comprehension, but how they are best integrated into working practices needs further investigation. Objective: This paper reports the findings of a realist evaluation of a web-based quality dashboard (QualDash) developed to support the use of national audit data in quality improvement. Methods: QualDash was co-designed with data users and installed in 8 clinical services (3 pediatric intensive care units and 5 cardiology services) across 5 health care organizations (sites A-E) in England between July and December 2019. Champions were identified to support adoption. Data to evaluate QualDash were collected between July 2019 and August 2021 and consisted of 148.5 hours of observations including hospital wards and clinical governance meetings, log files that captured the extent of use of QualDash over 12 months, and a questionnaire designed to assess the dashboard?s perceived usefulness and ease of use. Guided by the principles of realist evaluation, data were analyzed to understand how, why, and in what circumstances QualDash supported the use of national audit data in quality improvement. Results: The observations revealed that variation across sites in the amount and type of resources available to support data use, alongside staff interactions with QualDash, shaped its use and impact. Sites resourced with skilled audit support staff and established reporting systems (sites A and C) continued to use existing processes to report data. A number of constraints influenced use of QualDash in these sites including that some dashboard metrics were not configured in line with user expectations and staff were not fully aware how QualDash could be used to facilitate their work. In less well-resourced services, QualDash automated parts of their reporting process, streamlining the work of audit support staff (site B), and, in some cases, highlighted issues with data completeness that the service worked to address (site E). Questionnaire responses received from 23 participants indicated that QualDash was perceived as useful and easy to use despite its variable use in practice. Conclusions: Web-based dashboards have the potential to support data-driven improvement, providing access to visualizations that can help users address key questions about care quality. Findings from this study point to ways in which dashboard design might be improved to optimize use and impact in different contexts; this includes using data meaningful to stakeholders in the co-design process and actively engaging staff knowledgeable about current data use and routines in the scrutiny of the dashboard metrics and functions. In addition, consideration should be given to the processes of data collection and upload that underpin the quality of the data visualized and consequently its potential to stimulate quality improvement. International Registered Report Identifier (IRRID): RR2-10.1136/bmjopen-2019-033208
@article{wrro181546,
volume = {23},
number = {11},
month = {November},
author = {N Alvarado and L McVey and M Elshehaly and J Greenhalgh and D Dowding and R Ruddle and CP Gale and M Mamas and P Doherty and R West and R Feltbower and R Randell},
note = {{\copyright}Natasha Alvarado, Lynn McVey, Mai Elshehaly, Joanne Greenhalgh, Dawn Dowding, Roy Ruddle, Chris P Gale, Mamas Mamas, Patrick Doherty, Robert West, Richard Feltbower, Rebecca Randell. This is an open access article under the terms of the Creative Commons Attribution 4.0 International (CC BY 4.0)},
title = {Analysis of a Web-Based Dashboard to Support the Use of National Audit Data in Quality Improvement: Realist Evaluation},
publisher = {JMIR Publications},
year = {2021},
journal = {Journal of Medical Internet Research},
keywords = {data; QualDash; audit (2); dashboards (1); support (20); quality (15)},
url = {https://eprints.whiterose.ac.uk/181546/},
abstract = {Background:
Dashboards can support data-driven quality improvements in health care. They visualize data in ways intended to ease cognitive load and support data comprehension, but how they are best integrated into working practices needs further investigation.
Objective:
This paper reports the findings of a realist evaluation of a web-based quality dashboard (QualDash) developed to support the use of national audit data in quality improvement.
Methods:
QualDash was co-designed with data users and installed in 8 clinical services (3 pediatric intensive care units and 5 cardiology services) across 5 health care organizations (sites A-E) in England between July and December 2019. Champions were identified to support adoption. Data to evaluate QualDash were collected between July 2019 and August 2021 and consisted of 148.5 hours of observations including hospital wards and clinical governance meetings, log files that captured the extent of use of QualDash over 12 months, and a questionnaire designed to assess the dashboard?s perceived usefulness and ease of use. Guided by the principles of realist evaluation, data were analyzed to understand how, why, and in what circumstances QualDash supported the use of national audit data in quality improvement.
Results:
The observations revealed that variation across sites in the amount and type of resources available to support data use, alongside staff interactions with QualDash, shaped its use and impact. Sites resourced with skilled audit support staff and established reporting systems (sites A and C) continued to use existing processes to report data. A number of constraints influenced use of QualDash in these sites including that some dashboard metrics were not configured in line with user expectations and staff were not fully aware how QualDash could be used to facilitate their work. In less well-resourced services, QualDash automated parts of their reporting process, streamlining the work of audit support staff (site B), and, in some cases, highlighted issues with data completeness that the service worked to address (site E). Questionnaire responses received from 23 participants indicated that QualDash was perceived as useful and easy to use despite its variable use in practice.
Conclusions:
Web-based dashboards have the potential to support data-driven improvement, providing access to visualizations that can help users address key questions about care quality. Findings from this study point to ways in which dashboard design might be improved to optimize use and impact in different contexts; this includes using data meaningful to stakeholders in the co-design process and actively engaging staff knowledgeable about current data use and routines in the scrutiny of the dashboard metrics and functions. In addition, consideration should be given to the processes of data collection and upload that underpin the quality of the data visualized and consequently its potential to stimulate quality improvement.
International Registered Report Identifier (IRRID):
RR2-10.1136/bmjopen-2019-033208}
}t-distributed Stochastic Neighbour Embedding (t-SNE) has become a standard for exploratory data analysis, as it is capable of revealing clusters even in complex data while requiring minimal user input. While its run-time complexity limited it to small datasets in the past, recent efforts improved upon the expensive similarity computations and the previously quadratic minimization. Nevertheless, t-SNE still has high runtime and memory costs when operating on millions of points. We present a novel method for executing the t-SNE minimization. While our method overall retains a linear runtime complexity, we obtain a significant performance increase in the most expensive part of the minimization. We achieve a significant improvement without a noticeable decrease in accuracy even when targeting a 3D embedding. Our method constructs a pair of spatial hierarchies over the embedding, which are simultaneously traversed to approximate many N-body interactions at once. We demonstrate an efficient GPGPU implementation and evaluate its performance against state-of-the-art methods on a variety of datasets.
@article{wrro179727,
month = {September},
author = {M van de Ruit and M Billeter and E Eisemann},
note = {{\copyright} 2021 IEEE. Personal use of this material is permitted. Permission from IEEE must be obtained for all other uses, in any current or future media, including reprinting/republishing this material for advertising or promotional purposes, creating new collective works, for resale or redistribution to servers or lists, or reuse of any copyrighted component of this work in other works.},
title = {An Efficient Dual-Hierarchy t-SNE Minimization},
publisher = {Institute of Electrical and Electronics Engineers (IEEE)},
doi = {10.1109/tvcg.2021.3114817},
journal = {IEEE Transactions on Visualization and Computer Graphics},
pages = {1--1},
year = {2021},
keywords = {High dimensional data , dimensionality reduction , parallel data structures , dual-hierarchy , GPGPU},
url = {https://eprints.whiterose.ac.uk/179727/},
abstract = {t-distributed Stochastic Neighbour Embedding (t-SNE) has become a standard for exploratory data analysis, as it is capable of revealing clusters even in complex data while requiring minimal user input. While its run-time complexity limited it to small datasets in the past, recent efforts improved upon the expensive similarity computations and the previously quadratic minimization. Nevertheless, t-SNE still has high runtime and memory costs when operating on millions of points. We present a novel method for executing the t-SNE minimization. While our method overall retains a linear runtime complexity, we obtain a significant performance increase in the most expensive part of the minimization. We achieve a significant improvement without a noticeable decrease in accuracy even when targeting a 3D embedding. Our method constructs a pair of spatial hierarchies over the embedding, which are simultaneously traversed to approximate many N-body interactions at once. We demonstrate an efficient GPGPU implementation and evaluate its performance against state-of-the-art methods on a variety of datasets.}
}We introduce an automatic texture synthesis-based framework to convert an arbitrary input image into embroidery style art for garment design and online display. Given an input image and some reference textures, we first extract key embroidery regions from the input image using image segmentation. Each segmented region is single-colored and labeled with a stitch style automatically. We then fill these regions with embroidery reference textures via a stitch-style-based texture synthesis method. For each region, our approach maintains color similarity before and after synthesis, along with stitch style consistency. Compared to existing approaches, our method is able to generate digital embroidery patterns with faithful details automatically. Moreover, it can accept diverse input images effectively, enabling a fast preview of the embroidery patterns synthesized on digital garments interactively, and therefore accelerating the workflow from design to production. We validate our method through extensive experimentation and comparison.
@article{wrro177275,
volume = {37},
number = {9-11},
month = {September},
author = {X Guan and L Luo and H Li and H Wang and C Liu and S Wang and X Jin},
note = {{\copyright} The Author(s), under exclusive licence to Springer-Verlag GmbH Germany, part of Springer Nature 2021. This is an author produced version of an article published in Visual Computer. Uploaded in accordance with the publisher's self-archiving policy.},
title = {Automatic embroidery texture synthesis for garment design and online display},
publisher = {Springer},
year = {2021},
journal = {Visual Computer},
pages = {2553--2565},
keywords = {Embroidery; Non-photorealistic rendering; Image-based artistic rendering},
url = {https://eprints.whiterose.ac.uk/177275/},
abstract = {We introduce an automatic texture synthesis-based framework to convert an arbitrary input image into embroidery style art for garment design and online display. Given an input image and some reference textures, we first extract key embroidery regions from the input image using image segmentation. Each segmented region is single-colored and labeled with a stitch style automatically. We then fill these regions with embroidery reference textures via a stitch-style-based texture synthesis method. For each region, our approach maintains color similarity before and after synthesis, along with stitch style consistency. Compared to existing approaches, our method is able to generate digital embroidery patterns with faithful details automatically. Moreover, it can accept diverse input images effectively, enabling a fast preview of the embroidery patterns synthesized on digital garments interactively, and therefore accelerating the workflow from design to production. We validate our method through extensive experimentation and comparison.}
}The contour tree is one of the principal tools in scientific visualisation. It captures the connectivity of level sets in scalar fields. In order to apply the contour tree to exascale data we need efficient shared memory and distributed algorithms. Recent work has revealed a parallel performance bottleneck caused by substructures of contour trees called W-structures. We report two novel algorithms that detect and extract the W-structures. We also use the W-structures to show that extended persistence is not equivalent to branch decomposition and leaf-pruning.
@misc{wrro167116,
month = {September},
author = {P Hristov and HA Carr},
series = {Mathematics and Visualization (MATHVISUAL)},
note = {{\copyright} 2021 The Author(s), under exclusive license to Springer Nature Switzerland AG. This version of the article has been accepted for publication, after peer review (when applicable) and is subject to Springer Nature?s AM terms of use (https://www.springernature.com/gp/open-research/policies/accepted-manuscript-terms), but is not the Version of Record and does not reflect post-acceptance improvements, or any corrections. The Version of Record is available online at https://doi.org/10.1007/978-3-030-83500-2\_1.},
booktitle = {Topological Methods in Data Analysis and Visualization VI},
title = {W-Structures in Contour Trees},
publisher = {Springer},
year = {2021},
journal = {Topological Methods in Data Analysis and Visualization VI},
pages = {3--18},
url = {https://eprints.whiterose.ac.uk/167116/},
abstract = {The contour tree is one of the principal tools in scientific visualisation. It captures the connectivity of level sets in scalar fields. In order to apply the contour tree to exascale data we need efficient shared memory and distributed algorithms. Recent work has revealed a parallel performance bottleneck caused by substructures of contour trees called W-structures. We report two novel algorithms that detect and extract the W-structures. We also use the W-structures to show that extended persistence is not equivalent to branch decomposition and leaf-pruning.}
}This paper provides a new avenue for exploiting deep neural networks to improve physics-based simulation. Specifically, we integrate the classic Lagrangian mechanics with a deep autoencoder to accelerate elastic simulation of deformable solids. Due to the inertia effect, the dynamic equilibrium cannot be established without evaluating the second-order derivatives of the deep autoencoder network. This is beyond the capability of off-the-shelf automatic differentiation packages and algorithms, which mainly focus on the gradient evaluation. Solving the nonlinear force equilibrium is even more challenging if the standard Newton's method is to be used. This is because we need to compute a third-order derivative of the network to obtain the variational Hessian. We attack those difficulties by exploiting complex-step finite difference, coupled with reverse automatic differentiation. This strategy allows us to enjoy the convenience and accuracy of complex-step finite difference and in the meantime, to deploy complex-value perturbations as collectively as possible to save excessive network passes. With a GPU-based implementation, we are able to wield deep autoencoders (e.g., 10+ layers) with a relatively high-dimension latent space in real-time. Along this pipeline, we also design a sampling network and a weighting network to enable weight-varying Cubature integration in order to incorporate nonlinearity in the model reduction. We believe this work will inspire and benefit future research efforts in nonlinearly reduced physical simulation problems.
@article{wrro172996,
volume = {40},
number = {4},
month = {August},
author = {S Shen and Y Yang and T Shao and H Wang and C Jiang and L Lan and K Zhou},
note = {{\copyright} 2021 ACM. This is the author's version of the work. It is posted here for your personal use. Not for redistribution. The definitive Version of Record was published in ACM Transactions on Graphics, http://doi.org/10.1145/3450626.3459754},
title = {High-order Differentiable Autoencoder for Nonlinear Model Reduction},
publisher = {Association for Computing Machinery (ACM)},
year = {2021},
journal = {ACM Transactions on Graphics},
url = {https://eprints.whiterose.ac.uk/172996/},
abstract = {This paper provides a new avenue for exploiting deep neural networks to improve physics-based simulation. Specifically, we integrate the classic Lagrangian mechanics with a deep autoencoder to accelerate elastic simulation of deformable solids. Due to the inertia effect, the dynamic equilibrium cannot be established without evaluating the second-order derivatives of the deep autoencoder network. This is beyond the capability of off-the-shelf automatic differentiation packages and algorithms, which mainly focus on the gradient evaluation. Solving the nonlinear force equilibrium is even more challenging if the standard Newton's method is to be used. This is because we need to compute a third-order derivative of the network to obtain the variational Hessian. We attack those difficulties by exploiting complex-step finite difference, coupled with reverse automatic differentiation. This strategy allows us to enjoy the convenience and accuracy of complex-step finite difference and in the meantime, to deploy complex-value perturbations as collectively as possible to save excessive network passes. With a GPU-based implementation, we are able to wield deep autoencoders (e.g., 10+ layers) with a relatively high-dimension latent space in real-time. Along this pipeline, we also design a sampling network and a weighting network to enable weight-varying Cubature integration in order to incorporate nonlinearity in the model reduction. We believe this work will inspire and benefit future research efforts in nonlinearly reduced physical simulation problems.}
}Manual auscultatory is the gold standard for clinical non-invasive blood pressure (BP) measurement, but its usage is decreasing as it requires substantial professional skills and training, and its environmental concerns related to mercury toxicity. As an alternative, automatic oscillometric technique has been used as one of the most common methods for BP measurement, however, it only estimates BPs based on empirical equations. To overcome these problems, this study aimed to develop a deep learning-based automatic auscultatory BP measurement method, and clinically validate its performance. A deep learning-based method that utilized time-frequency characteristics and temporal dependence of segmented Korotkoff sound (KorS) signals and employed convolutional neural network (CNN) and long short-term memory (LSTM) network was developed and trained using KorS and cuff pressure signals recorded from 314 subjects. The BPs determined by the manual auscultatory method was used as the reference for each measurement. The measurement error and BP category classification performance of our proposed method were then validated on a separate dataset of 114 subjects. Its performance in comparison with the oscillometric method was also comprehensively analyzed. The deep learning method achieved measurement errors of 0.2 {$\pm$} 4.6 mmHg and 0.1 {$\pm$} 3.2 mmHg for systolic BP and diastolic BP, respectively, and achieved high sensitivity, specificity and accuracy (all {\ensuremath{>}} 90 \%) in classifying hypertensive subjects, which were better than those of the traditional oscillometric method. This validation study demonstrated that deep learning-based automatic auscultatory BP measurement can be developed to achieve high measurement accuracy and high BP category classification performance.
@article{wrro173893,
volume = {68},
month = {July},
author = {F Pan and P He and H Wang and Y Xu and X Pu and Q Zhao and F Chen and D Zheng},
note = {{\copyright} 2021 Elsevier Ltd. All rights reserved. This is an author produced version of an article published in Biomedical Signal Processing and Control. Uploaded in accordance with the publisher's self-archiving policy.},
title = {Development and Validation of a Deep Learning-based Automatic Auscultatory Blood Pressure Measurement Method},
publisher = {Elsevier},
journal = {Biomedical Signal Processing and Control},
year = {2021},
keywords = {Blood pressure measurement; Deep learning; Manual auscultatory method; Oscillometric method},
url = {https://eprints.whiterose.ac.uk/173893/},
abstract = {Manual auscultatory is the gold standard for clinical non-invasive blood pressure (BP) measurement, but its usage is decreasing as it requires substantial professional skills and training, and its environmental concerns related to mercury toxicity. As an alternative, automatic oscillometric technique has been used as one of the most common methods for BP measurement, however, it only estimates BPs based on empirical equations. To overcome these problems, this study aimed to develop a deep learning-based automatic auscultatory BP measurement method, and clinically validate its performance. A deep learning-based method that utilized time-frequency characteristics and temporal dependence of segmented Korotkoff sound (KorS) signals and employed convolutional neural network (CNN) and long short-term memory (LSTM) network was developed and trained using KorS and cuff pressure signals recorded from 314 subjects. The BPs determined by the manual auscultatory method was used as the reference for each measurement. The measurement error and BP category classification performance of our proposed method were then validated on a separate dataset of 114 subjects. Its performance in comparison with the oscillometric method was also comprehensively analyzed. The deep learning method achieved measurement errors of 0.2 {$\pm$} 4.6 mmHg and 0.1 {$\pm$} 3.2 mmHg for systolic BP and diastolic BP, respectively, and achieved high sensitivity, specificity and accuracy (all {\ensuremath{>}} 90 \%) in classifying hypertensive subjects, which were better than those of the traditional oscillometric method. This validation study demonstrated that deep learning-based automatic auscultatory BP measurement can be developed to achieve high measurement accuracy and high BP category classification performance.}
}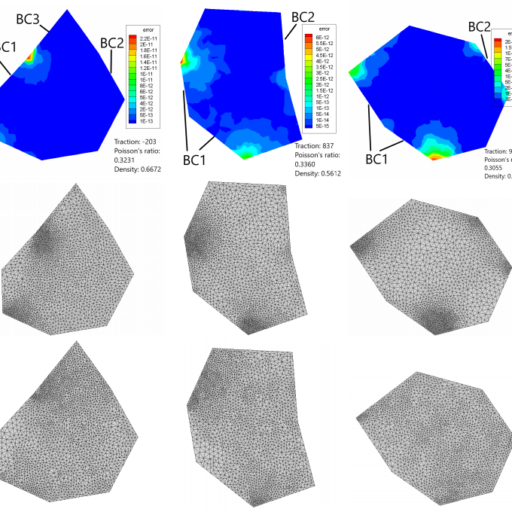
We describe a new algorithm for the generation of high quality tetrahedral meshes using artificial neural networks. The goal is to generate close-to-optimal meshes in the sense that the error in the computed finite element (FE) solution (for a target system of partial differential equations (PDEs)) is as small as it could be for a prescribed number of nodes or elements in the mesh. In this paper we illustrate and investigate our proposed approach by considering the equations of linear elasticity, solved on a variety of three-dimensional geometries. This class of PDE is selected due to its equivalence to an energy minimization problem, which therefore allows a quantitative measure of the relative accuracy of different meshes (by comparing the energy associated with the respective FE solutions on these meshes). Once the algorithm has been introduced it is evaluated on a variety of test problems, each with its own distinctive features and geometric constraints, in order to demonstrate its effectiveness and computational efficiency.
@article{wrro173988,
volume = {157-158},
month = {July},
author = {Z Zhang and PK Jimack and H Wang},
note = {{\copyright} 2021 Elsevier Ltd. This is an author produced version of an article published in Advances in Engineering Software. Uploaded in accordance with the publisher's self-archiving policy.},
title = {MeshingNet3D: Efficient generation of adapted tetrahedral meshes for computational mechanics},
publisher = {Elsevier},
journal = {Advances in Engineering Software},
year = {2021},
url = {https://eprints.whiterose.ac.uk/173988/},
abstract = {We describe a new algorithm for the generation of high quality tetrahedral meshes using artificial neural networks. The goal is to generate close-to-optimal meshes in the sense that the error in the computed finite element (FE) solution (for a target system of partial differential equations (PDEs)) is as small as it could be for a prescribed number of nodes or elements in the mesh. In this paper we illustrate and investigate our proposed approach by considering the equations of linear elasticity, solved on a variety of three-dimensional geometries. This class of PDE is selected due to its equivalence to an energy minimization problem, which therefore allows a quantitative measure of the relative accuracy of different meshes (by comparing the energy associated with the respective FE solutions on these meshes). Once the algorithm has been introduced it is evaluated on a variety of test problems, each with its own distinctive features and geometric constraints, in order to demonstrate its effectiveness and computational efficiency.}
}In this paper, we propose an effective global relation learning algorithm to recommend an appropriate location of a building unit for in-game customization of residential home complex. Given a construction layout, we propose a visual context-aware graph generation network that learns the implicit global relations among the scene components and infers the location of a new building unit. The proposed network takes as input the scene graph and the corresponding top-view depth image. It provides the location recommendations for a newly added building units by learning an auto-regressive edge distribution conditioned on existing scenes. We also introduce a global graph-image matching loss to enhance the awareness of essential geometry semantics of the site. Qualitative and quantitative experiments demonstrate that the recommended location well reflects the implicit spatial rules of components in the residential estates, and it is instructive and practical to locate the building units in the 3D scene of the complex construction.
@misc{wrro170233,
volume = {35},
number = {1},
month = {May},
author = {L Liu and Y Yang and T Shao and H Wang and K Zhou},
booktitle = {Thirty-Fifth AAAI Conference on Artificial Intelligence},
title = {In-game Residential Home Planning via Visual Context-aware Global Relation Learning},
publisher = {Association for the Advancement of Artificial Intelligence},
year = {2021},
journal = {AAAI-21 Technical Tracks 1},
pages = {336--343},
url = {https://eprints.whiterose.ac.uk/170233/},
abstract = {In this paper, we propose an effective global relation learning algorithm to recommend an appropriate location of a building unit for in-game customization of residential home complex. Given a construction layout, we propose a visual context-aware graph generation network that learns the implicit global relations among the scene components and infers the location of a new building unit. The proposed network takes as input the scene graph and the corresponding top-view depth image. It provides the location recommendations for a newly added building units by learning an auto-regressive edge distribution conditioned on existing scenes. We also introduce a global graph-image matching loss to enhance the awareness of essential geometry semantics of the site. Qualitative and quantitative experiments demonstrate that the recommended location well reflects the implicit spatial rules of components in the residential estates, and it is instructive and practical to locate the building units in the 3D scene of the complex construction.}
}Character rigging is universally needed in computer graphics but notoriously laborious. We present a new method, HeterSkinNet, aiming to fully automate such processes and significantly boost productivity. Given a character mesh and skeleton as input, our method builds a heterogeneous graph that treats the mesh vertices and the skeletal bones as nodes of different types and uses graph convolutions to learn their relationships. To tackle the graph heterogeneity, we propose a new graph network convolution operator that transfers information between heterogeneous nodes. The convolution is based on a new distance HollowDist that quantifies the relations between mesh vertices and bones. We show that HeterSkinNet is robust for production characters by providing the ability to incorporate meshes and skeletons with arbitrary topologies and morphologies (e.g., out-of-body bones, disconnected mesh components, etc.). Through exhaustive comparisons, we show that HeterSkinNet outperforms state-of-the-art methods by large margins in terms of rigging accuracy and naturalness. HeterSkinNet provides a solution for effective and robust character rigging.
@misc{wrro171781,
volume = {4},
number = {1},
month = {April},
author = {X Pan and J Huang and J Mai and H Wang and H Li and T Su and W Wang and X Jin},
note = {{\copyright} 2021 ACM. This is an author produced version of a conference paper published in Proceedings of the ACM on Computer Graphics and Interactive Techniques. Uploaded in accordance with the publisher's self-archiving policy.},
booktitle = {I3D 21 Symposium on Interactive 3D Graphics and Games},
title = {HeterSkinNet: A Heterogeneous Network for Skin Weights Prediction},
publisher = {Association for Computing Machinery},
year = {2021},
journal = {Proceedings of the ACM on Computer Graphics and Interactive Techniques},
url = {https://eprints.whiterose.ac.uk/171781/},
abstract = {Character rigging is universally needed in computer graphics but notoriously laborious. We present a new method, HeterSkinNet, aiming to fully automate such processes and significantly boost productivity. Given a character mesh and skeleton as input, our method builds a heterogeneous graph that treats the mesh vertices and the skeletal bones as nodes of different types and uses graph convolutions to learn their relationships. To tackle the graph heterogeneity, we propose a new graph network convolution operator that transfers information between heterogeneous nodes. The convolution is based on a new distance HollowDist that quantifies the relations between mesh vertices and bones. We show that HeterSkinNet is robust for production characters by providing the ability to incorporate meshes and skeletons with arbitrary topologies and morphologies (e.g., out-of-body bones, disconnected mesh components, etc.). Through exhaustive comparisons, we show that HeterSkinNet outperforms state-of-the-art methods by large margins in terms of rigging accuracy and naturalness. HeterSkinNet provides a solution for effective and robust character rigging.}
}As data sets grow to exascale, automated data analysis and visualisation are increasingly important, to intermediate human understanding and to reduce demands on disk storage via in situ analysis. Trends in architecture of high performance computing systems necessitate analysis algorithms to make effective use of combinations of massively multicore and distributed systems. One of the principal analytic tools is the contour tree, which analyses relationships between contours to identify features of more than local importance. Unfortunately, the predominant algorithms for computing the contour tree are explicitly serial, and founded on serial metaphors, which has limited the scalability of this form of analysis. While there is some work on distributed contour tree computation, and separately on hybrid GPU-CPU computation, there is no efficient algorithm with strong formal guarantees on performance allied with fast practical performance. We report the first shared SMP algorithm for fully parallel contour tree computation, with formal guarantees of O(lgnlgt) parallel steps and O(nlgn) work, and implementations with more than 30{$\times$} parallel speed up on both CPU using TBB and GPU using Thrust and up 70{$\times$} speed up compared to the serial sweep and merge algorithm.
@article{wrro151668,
volume = {27},
number = {4},
month = {April},
author = {HA Carr and GH Weber and CM Sewell and O R{\"u}bel and P Fasel and JP Ahrens},
note = {Protected by copyright. Personal use of this material is permitted. Permission from IEEE must be obtained for all other uses, in any current or future media, including reprinting/republishing this material for advertising or promotional purposes, creating new collective works, for resale or redistribution to servers or lists, or reuse of any copyrighted component of this work in other works.},
title = {Scalable Contour Tree Computation by Data Parallel Peak Pruning},
publisher = {Institute of Electrical and Electronics Engineers (IEEE)},
year = {2021},
journal = {IEEE Transactions on Visualization and Computer Graphics},
pages = {2437--2454},
url = {https://eprints.whiterose.ac.uk/151668/},
abstract = {As data sets grow to exascale, automated data analysis and visualisation are increasingly important, to intermediate human understanding and to reduce demands on disk storage via in situ analysis. Trends in architecture of high performance computing systems necessitate analysis algorithms to make effective use of combinations of massively multicore and distributed systems. One of the principal analytic tools is the contour tree, which analyses relationships between contours to identify features of more than local importance. Unfortunately, the predominant algorithms for computing the contour tree are explicitly serial, and founded on serial metaphors, which has limited the scalability of this form of analysis. While there is some work on distributed contour tree computation, and separately on hybrid GPU-CPU computation, there is no efficient algorithm with strong formal guarantees on performance allied with fast practical performance. We report the first shared SMP algorithm for fully parallel contour tree computation, with formal guarantees of O(lgnlgt) parallel steps and O(nlgn) work, and implementations with more than 30{$\times$} parallel speed up on both CPU using TBB and GPU using Thrust and up 70{$\times$} speed up compared to the serial sweep and merge algorithm.}
}Contour trees are used for topological data analysis in scientific visualization. While originally computed with serial algorithms, recent work has introduced a vector-parallel algorithm. However, this algorithm is relatively slow for fully augmented contour trees which are needed for many practical data analysis tasks. We therefore introduce a representation called the hyperstructure that enables efficient searches through the contour tree and use it to construct a fully augmented contour tree in data parallel, with performance on average 6 times faster than the state-of-the-art parallel algorithm in the TTK topological toolkit.
@article{wrro171318,
month = {March},
title = {Optimization and Augmentation for Data Parallel Contour Trees},
author = {HA Carr and O R{\"u}bel and GH Weber and JP Ahrens},
publisher = {Institute of Electrical and Electronics Engineers},
year = {2021},
note = {{\copyright} 2021 IEEE. Personal use of this material is permitted. Permission from IEEE must be obtained for all other uses, in any current or future media, including reprinting/republishing this material for advertising or promotional purposes, creating new collective works, for resale or redistribution to servers or lists, or reuse of any copyrighted component of this work in other works.},
journal = {IEEE Transactions on Visualization and Computer Graphics},
keywords = {Computational Topology, Contour Tree, Parallel Algorith},
url = {https://eprints.whiterose.ac.uk/171318/},
abstract = {Contour trees are used for topological data analysis in scientific visualization. While originally computed with serial algorithms, recent work has introduced a vector-parallel algorithm. However, this algorithm is relatively slow for fully augmented contour trees which are needed for many practical data analysis tasks. We therefore introduce a representation called the hyperstructure that enables efficient searches through the contour tree and use it to construct a fully augmented contour tree in data parallel, with performance on average 6 times faster than the state-of-the-art parallel algorithm in the TTK topological toolkit.}
}Adapting dashboard design to different contexts of use is an open question in visualisation research. Dashboard designers often seek to strike a balance between dashboard adaptability and ease-of-use, and in hospitals challenges arise from the vast diversity of key metrics, data models and users involved at different organizational levels. In this design study, we present QualDash, a dashboard generation engine that allows for the dynamic configuration and deployment of visualisation dashboards for healthcare quality improvement (QI). We present a rigorous task analysis based on interviews with healthcare professionals, a co-design workshop and a series of one-on-one meetings with front line analysts. From these activities we define a metric card metaphor as a unit of visual analysis in healthcare QI, using this concept as a building block for generating highly adaptable dashboards, and leading to the design of a Metric Specification Structure (MSS). Each MSS is a JSON structure which enables dashboard authors to concisely configure unit-specific variants of a metric card, while offloading common patterns that are shared across cards to be preset by the engine. We reflect on deploying and iterating the design of OualDash in cardiology wards and pediatric intensive care units of five NHS hospitals. Finally, we report evaluation results that demonstrate the adaptability, ease-of-use and usefulness of QualDash in a real-world scenario.
@article{wrro165165,
volume = {27},
number = {2},
month = {February},
author = {M Elshehaly and R Randell and M Brehmer and L McVey and N Alvarado and CP Gale and RA Ruddle},
note = {{\copyright} 2020, IEEE. Personal use of this material is permitted. Permission from IEEE must be obtained for all other uses, in any current or future media, including reprinting/republishing this material for advertising or promotional purposes, creating new collective works, for resale or redistribution to servers or lists, or reuse of any copyrighted component of this work in other works.},
title = {QualDash: Adaptable Generation of Visualisation Dashboards for Healthcare Quality Improvement},
publisher = {IEEE},
year = {2021},
journal = {IEEE Transactions on Visualization and Computer Graphics},
pages = {689--699},
keywords = {Information visualisation, task analysis, co-design, dashboards, design study, healthcare},
url = {https://eprints.whiterose.ac.uk/165165/},
abstract = {Adapting dashboard design to different contexts of use is an open question in visualisation research. Dashboard designers often seek to strike a balance between dashboard adaptability and ease-of-use, and in hospitals challenges arise from the vast diversity of key metrics, data models and users involved at different organizational levels. In this design study, we present QualDash, a dashboard generation engine that allows for the dynamic configuration and deployment of visualisation dashboards for healthcare quality improvement (QI). We present a rigorous task analysis based on interviews with healthcare professionals, a co-design workshop and a series of one-on-one meetings with front line analysts. From these activities we define a metric card metaphor as a unit of visual analysis in healthcare QI, using this concept as a building block for generating highly adaptable dashboards, and leading to the design of a Metric Specification Structure (MSS). Each MSS is a JSON structure which enables dashboard authors to concisely configure unit-specific variants of a metric card, while offloading common patterns that are shared across cards to be preset by the engine. We reflect on deploying and iterating the design of OualDash in cardiology wards and pediatric intensive care units of five NHS hospitals. Finally, we report evaluation results that demonstrate the adaptability, ease-of-use and usefulness of QualDash in a real-world scenario.}
}Electroencephalograph (EEG) has been widely applied for brain-computer interface (BCI) which enables paralyzed people to directly communicate with and control of external devices, due to its portability, high temporal resolution, ease of use and low cost. Of various EEG paradigms, steady-state visual evoked potential (SSVEP)-based BCI system which uses multiple visual stimuli (such as LEDs or boxes on a computer screen) flickering at different frequencies has been widely explored in the past decades due to its fast communication rate and high signal-to-noise ratio. In this paper, we review the current research in SSVEP-based BCI, focusing on the data analytics that enables continuous, accurate detection of SSVEPs and thus high information transfer rate. The main technical challenges, including signal pre-processing, spectrum analysis, signal decomposition, spatial filtering in particular canonical correlation analysis and its variations, and classification techniques are described in this paper. Research challenges and opportunities in spontaneous brain activities, mental fatigue, transfer learning as well as hybrid BCI are also discussed.
@article{wrro164887,
volume = {21},
number = {2},
month = {January},
author = {Y Zhang and SQ Xie and H Wang and Z Yu and Z Zhang},
note = {{\copyright} 2020 IEEE. Personal use of this material is permitted. Permission from IEEE must be obtained for all other uses, in any current or future media, including reprinting/republishing this material for advertising or promotional purposes, creating new collective works, for resale or redistribution to servers or lists, or reuse of any copyrighted component of this work in other works. Uploaded in accordance with the publisher's self-archiving policy.},
title = {Data Analytics in Steady-State Visual Evoked Potential-based Brain-Computer Interface: A Review},
publisher = {Institute of Electrical and Electronics Engineers},
year = {2021},
journal = {IEEE Sensors Journal},
pages = {1124--1138},
keywords = {Brain-computer interface (BCI); steady state visual evoked potential (SSVEP); healthcare application; data analytics; canonical correlation analysis},
url = {https://eprints.whiterose.ac.uk/164887/},
abstract = {Electroencephalograph (EEG) has been widely applied for brain-computer interface (BCI) which enables paralyzed people to directly communicate with and control of external devices, due to its portability, high temporal resolution, ease of use and low cost. Of various EEG paradigms, steady-state visual evoked potential (SSVEP)-based BCI system which uses multiple visual stimuli (such as LEDs or boxes on a computer screen) flickering at different frequencies has been widely explored in the past decades due to its fast communication rate and high signal-to-noise ratio. In this paper, we review the current research in SSVEP-based BCI, focusing on the data analytics that enables continuous, accurate detection of SSVEPs and thus high information transfer rate. The main technical challenges, including signal pre-processing, spectrum analysis, signal decomposition, spatial filtering in particular canonical correlation analysis and its variations, and classification techniques are described in this paper. Research challenges and opportunities in spontaneous brain activities, mental fatigue, transfer learning as well as hybrid BCI are also discussed.}
}Data-driven modeling of human motions is ubiquitous in computer graphics and vision applications. Such problems can be approached by deep learning on a large amount data. However, existing methods can be sub-optimal for two reasons. First, skeletal information has not been fully utilized. Unlike images, it is difficult to define spatial proximity in skeletal motions in the way that deep networks can be applied for feature extraction. Second, motion is time-series data with strong multi-modal temporal correlations between frames. A frame could lead to different motions; on the other hand, long-range dependencies exist where a number of frames in the beginning correlate to a number of frames later. Ineffective temporal modeling would either under-estimate the multi-modality and variance. We propose a new deep network to tackle these challenges by creating a natural motion manifold that is versatile for many applications. The network has a new spatial component and is equipped with a new batch prediction model that predicts a large number of frames at once, such that long-term temporally-based objective functions can be employed to correctly learn the motion multi-modality and variances. We demonstrate that our system can create superior results comparing to existing work in multiple applications.
@article{wrro149862,
volume = {27},
number = {1},
month = {January},
author = {H Wang and ESL Ho and HPH Shum and Z Zhu},
note = {This article is protected by copyright. Personal use of this material is permitted. Permission from IEEE must be obtained for all other uses, in any current or future media, including reprinting/republishing this material for advertising or promotional purposes, creating new collective works, for resale or redistribution to servers or lists, or reuse of any copyrighted component of this work in other works.},
title = {Spatio-temporal Manifold Learning for Human Motions via Long-horizon Modeling},
publisher = {Institute of Electrical and Electronics Engineers},
year = {2021},
journal = {IEEE Transactions on Visualization and Computer Graphics},
pages = {216--227},
keywords = {Computer Graphics, Computer Animation, Character Animation, Deep Learning},
url = {https://eprints.whiterose.ac.uk/149862/},
abstract = {Data-driven modeling of human motions is ubiquitous in computer graphics and vision applications. Such problems can be approached by deep learning on a large amount data. However, existing methods can be sub-optimal for two reasons. First, skeletal information has not been fully utilized. Unlike images, it is difficult to define spatial proximity in skeletal motions in the way that deep networks can be applied for feature extraction. Second, motion is time-series data with strong multi-modal temporal correlations between frames. A frame could lead to different motions; on the other hand, long-range dependencies exist where a number of frames in the beginning correlate to a number of frames later. Ineffective temporal modeling would either under-estimate the multi-modality and variance. We propose a new deep network to tackle these challenges by creating a natural motion manifold that is versatile for many applications. The network has a new spatial component and is equipped with a new batch prediction model that predicts a large number of frames at once, such that long-term temporally-based objective functions can be employed to correctly learn the motion multi-modality and variances. We demonstrate that our system can create superior results comparing to existing work in multiple applications.}
}Event sequences are central to the analysis of data in domains that range from biology and health, to logfile analysis and people's everyday behavior. Many visualization tools have been created for such data, but people are error-prone when asked to judge the similarity of event sequences with basic presentation methods. This paper describes an experiment that investigates whether local and global alignment techniques improve people's performance when judging sequence similarity. Participants were divided into three groups (basic vs. local vs. global alignment), and each participant judged the similarity of 180 sets of pseudo-randomly generated sequences. Each set comprised a target, a correct choice and a wrong choice. After training, the global alignment group was more accurate than the local alignment group (98\% vs. 93\% correct), with the basic group getting 95\% correct. Participants' response times were primarily affected by the number of event types, the similarity of sequences (measured by the Levenshtein distance) and the edit types (nine combinations of deletion, insertion and substitution). In summary, global alignment is superior and people's performance could be further improved by choosing alignment parameters that explicitly penalize sequence mismatches.
@article{wrro172191,
month = {January},
title = {The Effect of Alignment on Peoples Ability to Judge Event Sequence Similarity},
author = {RA Ruddle and J Bernard and H Lucke-Tieke and T May and J Kohlhammer},
publisher = {IEEE},
year = {2021},
note = {{\copyright} 2020 IEEE. Personal use of this material is permitted. Permission from IEEE must be obtained for all other uses, in any current or future media, including reprinting/republishing this material for advertising or promotional purposes, creating new collective works, for resale or redistribution to servers or lists, or reuse of any copyrighted component of this work in other works.},
journal = {IEEE Transactions on Visualization and Computer Graphics},
keywords = {Event sequence visualization; sequence alignment; evaluation; user study},
url = {https://eprints.whiterose.ac.uk/172191/},
abstract = {Event sequences are central to the analysis of data in domains that range from biology and health, to logfile analysis and people's everyday behavior. Many visualization tools have been created for such data, but people are error-prone when asked to judge the similarity of event sequences with basic presentation methods. This paper describes an experiment that investigates whether local and global alignment techniques improve people's performance when judging sequence similarity. Participants were divided into three groups (basic vs. local vs. global alignment), and each participant judged the similarity of 180 sets of pseudo-randomly generated sequences. Each set comprised a target, a correct choice and a wrong choice. After training, the global alignment group was more accurate than the local alignment group (98\% vs. 93\% correct), with the basic group getting 95\% correct. Participants' response times were primarily affected by the number of event types, the similarity of sequences (measured by the Levenshtein distance) and the edit types (nine combinations of deletion, insertion and substitution). In summary, global alignment is superior and people's performance could be further improved by choosing alignment parameters that explicitly penalize sequence mismatches.}
}Skeletal motion plays a vital role in human activity recognition as either an independent data source or a complement [33]. The robustness of skeleton-based activity recognizers has been questioned recently [29], [50], which shows that they are vulnerable to adversarial attacks when the full-knowledge of the recognizer is accessible to the attacker. However, this white-box requirement is overly restrictive in most scenarios and the attack is not truly threatening. In this paper, we show that such threats do exist under black-box settings too. To this end, we propose the first black-box adversarial attack method BASAR. Through BASAR, we show that adversarial attack is not only truly a threat but also can be extremely deceitful, because on-manifold adversarial samples are rather common in skeletal motions, in contrast to the common belief that adversarial samples only exist off-manifold [18]. Through exhaustive evaluation and comparison, we show that BASAR can deliver successful attacks across models, data, and attack modes. Through harsh perceptual studies, we show that it achieves effective yet imperceptible attacks. By analyzing the attack on different activity recognizers, BASAR helps identify the potential causes of their vulnerability and provides insights on what classifiers are likely to be more robust against attack.
@misc{wrro171782,
author = {Y Diao and T Shao and Y-L Yang and K Zhou and H Wang},
note = {{\copyright} 2021 by The Institute of Electrical and Electronics Engineers, Inc. Personal use of this material is permitted. Permission from IEEE must be obtained for all other uses, in any current or future media, including reprinting/republishing this material for advertising or promotional purposes, creating new collective works, for resale or redistribution to servers or lists, or reuse of any copyrighted component of this work in other works.},
booktitle = {The Conference on Computer Vision and Pattern Recognition},
title = {BASAR:Black-box Attack on Skeletal Action Recognition},
publisher = {IEEE},
journal = {Proccedings of the 2021 IEEE/CVF Conference on Computer Vision and Pattern Recognition (CVPR)},
pages = {7593--7603},
year = {2021},
url = {https://eprints.whiterose.ac.uk/171782/},
abstract = {Skeletal motion plays a vital role in human activity recognition as either an independent data source or a complement [33]. The robustness of skeleton-based activity recognizers has been questioned recently [29], [50], which shows that they are vulnerable to adversarial attacks when the full-knowledge of the recognizer is accessible to the attacker. However, this white-box requirement is overly restrictive in most scenarios and the attack is not truly threatening. In this paper, we show that such threats do exist under black-box settings too. To this end, we propose the first black-box adversarial attack method BASAR. Through BASAR, we show that adversarial attack is not only truly a threat but also can be extremely deceitful, because on-manifold adversarial samples are rather common in skeletal motions, in contrast to the common belief that adversarial samples only exist off-manifold [18]. Through exhaustive evaluation and comparison, we show that BASAR can deliver successful attacks across models, data, and attack modes. Through harsh perceptual studies, we show that it achieves effective yet imperceptible attacks. By analyzing the attack on different activity recognizers, BASAR helps identify the potential causes of their vulnerability and provides insights on what classifiers are likely to be more robust against attack.}
}Warp knitted fabrics are typically three-dimensional (3D) structures, and their design is strongly dependent on the structural simulation. Most of existing simulation methods are only capable of two-dimensional (2D) modeling, which lacks perceptual realism and cannot show design defects, making it hard for manufacturers to produce the required fabrics. The few existing methods capable of 3D structural simulation are computationally demanding and therefore can only run on powerful computers, which makes it hard to utilize online platforms (e.g. clouds, mobile devices, etc.) for simulation and design communication. To fill the gap, a novel, lightweight and agile geometric representation of warp knitting loops is proposed to establish a new framework of 3D simulation of complex warp knitted structures. Further, the new representation has great simplicity, flexibility and versatility and is used to build high-level models in representing the 3D structures of warp knitted fabrics with complex topologies. Simulations of a variety of warp knitted fabrics are presented to demonstrate the capacity and generalizability of this newly proposed methodology. It has also been used in virtual design of warp knitted fabrics in wireless mobile devices for digital manufacture and provides a functional reference model based on this simplified unit cell of warp knitted loops to simulate more realistic 3D warp knitted fabrics.
@article{wrro159605,
volume = {90},
number = {23-24},
month = {December},
author = {Y Ji and G Jiang and M Tang and N Mao and H Wang},
note = {{\copyright} The Author(s) 2020. This is an author produced version of an article published in Textile Research Journal. Uploaded in accordance with the publisher's self-archiving policy.},
title = {Three-dimensional simulation of warp knitted structures based on geometric unit cell of loop yarns},
publisher = {SAGE Publications},
year = {2020},
journal = {Textile Research Journal},
pages = {2639--2647},
keywords = {Warp knitted fabric, 3D simulation, geometric modeling, 3D loop model},
url = {https://eprints.whiterose.ac.uk/159605/},
abstract = {Warp knitted fabrics are typically three-dimensional (3D) structures, and their design is strongly dependent on the structural simulation. Most of existing simulation methods are only capable of two-dimensional (2D) modeling, which lacks perceptual realism and cannot show design defects, making it hard for manufacturers to produce the required fabrics. The few existing methods capable of 3D structural simulation are computationally demanding and therefore can only run on powerful computers, which makes it hard to utilize online platforms (e.g. clouds, mobile devices, etc.) for simulation and design communication. To fill the gap, a novel, lightweight and agile geometric representation of warp knitting loops is proposed to establish a new framework of 3D simulation of complex warp knitted structures. Further, the new representation has great simplicity, flexibility and versatility and is used to build high-level models in representing the 3D structures of warp knitted fabrics with complex topologies. Simulations of a variety of warp knitted fabrics are presented to demonstrate the capacity and generalizability of this newly proposed methodology. It has also been used in virtual design of warp knitted fabrics in wireless mobile devices for digital manufacture and provides a functional reference model based on this simplified unit cell of warp knitted loops to simulate more realistic 3D warp knitted fabrics.}
}The contour tree is a tool for understanding the topological structure of a scalar field. Recent work has built efficient contour tree algorithms for shared memory parallel computation, driven by the need to analyze large data sets in situ while the simulation is running. Unfortunately, methods for using the contour tree for practical data analysis are still primarily serial, including single isocontour extraction, branch decomposition and simplification. We report data parallel methods for these tasks using a data structure called the hyperstructure and a general purpose approach called a hypersweep. We implement and integrate these methods with a Cinema database that stores features as depth images and with a web server that reconstructs the features for direct visualization.
@misc{wrro167115,
month = {December},
author = {P Hristov and G Weber and H Carr and O R{\"u}bel and JP Ahrens},
note = {{\copyright} 2020, IEEE. Personal use of this material is permitted. Permission from IEEE must be obtained for all other uses, in any current or future media, including reprinting/republishing this material for advertising or promotional purposes, creating new collective works, for resale or redistribution to servers or lists, or reuse of any copyrighted component of this work in other works.},
booktitle = {2020 IEEE 10th Symposium on Large Data Analysis and Visualization (LDAV)},
title = {Data Parallel Hypersweeps for in Situ Topological Analysis},
publisher = {IEEE},
year = {2020},
journal = {Proceedings of2020 IEEE 10th Symposium on Large Data Analysis and Visualization (LDAV)},
pages = {12--21},
keywords = {contour tree, in situ, scalar field, geometric measures, branch decomposition},
url = {https://eprints.whiterose.ac.uk/167115/},
abstract = {The contour tree is a tool for understanding the topological structure of a scalar field. Recent work has built efficient contour tree algorithms for shared memory parallel computation, driven by the need to analyze large data sets in situ while the simulation is running. Unfortunately, methods for using the contour tree for practical data analysis are still primarily serial, including single isocontour extraction, branch decomposition and simplification. We report data parallel methods for these tasks using a data structure called the hyperstructure and a general purpose approach called a hypersweep. We implement and integrate these methods with a Cinema database that stores features as depth images and with a web server that reconstructs the features for direct visualization.}
}After two decades in computational topology, it is clearly a computationally challenging area. Not only do we have the usual algorithmic and programming difficulties with establishing correctness, we also have a class of problems that are mathematically complex and notationally fragile. Effective development and deployment therefore requires an additional step - construction or selection of suitable test cases. Since we cannot test all possible inputs, our selection of test cases expresses our understanding of the task and of the problems involved. Moreover, the scale of the data sets we work with is such that, no matter how unlikely the behaviour mathematically, it is nearly guaranteed to occur at scale in every run. The test cases we choose are therefore tightly coupled with mathematically pathological cases, and need to be developed using the skills expressed most obviously in the constructing mathematical counterexamples. This paper is therefore a first attempt at reporting, classifying and analysing test cases previously used in computational topology, and the expression of a philosophy of how to test topological code.
@incollection{wrro144396,
month = {December},
author = {H Carr and J Tierny and GH Weber},
series = {Mathematics and Visualization book series},
note = {{\copyright} Springer Nature Switzerland AG 2020. This is an author accepted version of a chapter published in Carr H., Fujishiro I., Sadlo F., Takahashi S. (eds) Topological Methods in Data Analysis and Visualization V. TopoInVis 2017. Mathematics and Visualization. Springer, Cham. Uploaded in accordance with the publisher's self-archiving policy.},
booktitle = {Topological Methods in Data Analysis and Visualization V},
title = {Pathological and Test Cases For Reeb Analysis},
publisher = {Springer},
year = {2020},
pages = {103--120},
keywords = {Computational Topology, Reeb Space, Reeb Graph, Contour Tree, Reeb Analysis},
url = {https://eprints.whiterose.ac.uk/144396/},
abstract = {After two decades in computational topology, it is clearly a computationally challenging area. Not only do we have the usual algorithmic and programming difficulties with establishing correctness, we also have a class of problems that are mathematically complex and notationally fragile. Effective development and deployment therefore requires an additional step - construction or selection of suitable test cases. Since we cannot test all possible inputs, our selection of test cases expresses our understanding of the task and of the problems involved. Moreover, the scale of the data sets we work with is such that, no matter how unlikely the behaviour mathematically, it is nearly guaranteed to occur at scale in every run. The test cases we choose are therefore tightly coupled with mathematically pathological cases, and need to be developed using the skills expressed most obviously in the constructing mathematical counterexamples. This paper is therefore a first attempt at reporting, classifying and analysing test cases previously used in computational topology, and the expression of a philosophy of how to test topological code.}
}The fiber surface generalizes the popular isosurface to multi-fields, so that pre-images can be visualized as surfaces. As with the isosurface, however, the fiber surface suffers from visual occlusion. We propose to avoid such occlusion by restricting the components to only the relevant ones with a new component-wise flexing algorithm. The approach, flexible fiber surface, generalizes the manipulation idea found in the flexible isosurface for the fiber surface. The flexible isosurface in the original form, however, relies on the contour tree. For the fiber surface, this corresponds to the Reeb space, which is challenging for both the computation and user interaction. We thus take a Reeb-free approach, in which one does not compute the Reeb space. Under this constraint, we generalize a few selected interactions in the flexible isosurface and discuss the implication of the restriction.
@incollection{wrro144583,
month = {December},
author = {D Sakurai and K Ono and H Carr and J Nonaka and T Kawanabe},
series = {Mathematics and Visualization book series},
note = {{\copyright} Springer Nature Switzerland AG 2020. This is an author accepted version of a paper published in Sakurai D., Ono K., Carr H., Nonaka J., Kawanabe T. (2020) Flexible Fiber Surfaces: A Reeb-Free Approach. In: Carr H., Fujishiro I., Sadlo F., Takahashi S. (eds) Topological Methods in Data Analysis and Visualization V. TopoInVis 2017. Mathematics and Visualization. Springer, Cham. Uploaded in accordance with the publisher's self-archiving policy.},
booktitle = {Topological Methods in Data Analysis and Visualization V},
title = {Flexible Fiber Surfaces: A Reeb-Free Approach},
publisher = {Springer International Publishing},
year = {2020},
url = {https://eprints.whiterose.ac.uk/144583/},
abstract = {The fiber surface generalizes the popular isosurface to multi-fields, so that pre-images can be visualized as surfaces. As with the isosurface, however, the fiber surface suffers from visual occlusion. We propose to avoid such occlusion by restricting the components to only the relevant ones with a new component-wise flexing algorithm. The approach, flexible fiber surface, generalizes the manipulation idea found in the flexible isosurface for the fiber surface. The flexible isosurface in the original form, however, relies on the contour tree. For the fiber surface, this corresponds to the Reeb space, which is challenging for both the computation and user interaction. We thus take a Reeb-free approach, in which one does not compute the Reeb space. Under this constraint, we generalize a few selected interactions in the flexible isosurface and discuss the implication of the restriction.}
}As Exascale computing proliferates, we see an accelerating shift towards clusters with thousands of nodes and thousands of cores per node, often on the back of commodity graphics processing units. This paper argues that this drives a once in a generation shift of computation, and that fundamentals of computer science therefore need to be re-examined. Exploiting the full power of Exascale computation will require attention to the fundamentals of programme design and specification, programming language design, systems and software engineering, analytic, performance and cost models, fundamental algorithmic design, and to increasing replacement of human bandwidth by computational analysis. As part of this, we will argue that Exascale computing will require a significant degree of co-design and close attention to the economics underlying the challenges ahead.
@misc{wrro164225,
volume = {12441},
month = {December},
author = {K Djemame and H Carr},
note = {{\copyright} Springer Nature Switzerland AG 2020. This is an author produced version of a conference paper published in Lecture Notes in Computer Science. Uploaded in accordance with the publisher's self-archiving policy.
This version of the article has been accepted for publication, after peer review (when applicable) and is subject to Springer Nature?s AM terms of use (https://www.springernature.com/gp/open-research/policies/accepted-manuscript-terms), but is not the Version of Record and does not reflect post-acceptance improvements, or any corrections. The Version of Record is available online at: https://doi.org/10.1007/978-3-030-63058-4\_19 .},
booktitle = {GECON2020: 17th International Conference on the Economics of Grids, Clouds, Systems, and Services},
editor = {K Djemame and J Altmann and J{\'A} Ba{\~n}ares and O Agmon Ben-Yehuda and V Stankovski and B Tuffin},
title = {Exascale Computing Deployment Challenges},
address = {Cham, Switzerland},
publisher = {Springer},
year = {2020},
journal = {Lecture Notes in Computer Science},
pages = {211--216},
keywords = {Exascale computing; High performance computing; Holistic approach; Economics},
url = {https://eprints.whiterose.ac.uk/164225/},
abstract = {As Exascale computing proliferates, we see an accelerating shift towards clusters with thousands of nodes and thousands of cores per node, often on the back of commodity graphics processing units. This paper argues that this drives a once in a generation shift of computation, and that fundamentals of computer science therefore need to be re-examined. Exploiting the full power of Exascale computation will require attention to the fundamentals of programme design and specification, programming language design, systems and software engineering, analytic, performance and cost models, fundamental algorithmic design, and to increasing replacement of human bandwidth by computational analysis. As part of this, we will argue that Exascale computing will require a significant degree of co-design and close attention to the economics underlying the challenges ahead.}
}Eye-tracking with gaze estimation is a key element in many applications, ranging from foveated rendering and user interaction to behavioural analysis and usage metrics. For virtual reality, eye-tracking typically relies on near-eye cameras that are mounted in the VR headset. Such methods usually involve an initial calibration to create a mapping from eye features to a gaze position. However, the accuracy based on the initial calibration degrades when the position of the headset relative to the users? head changes; this is especially noticeable when users readjust the headset for comfort or even completely remove it for a short while. We show that a correction of such shifts can be achieved via 2D drift vectors in eye space. Our method estimates these drifts by extracting salient cues from the shown virtual environment to determine potential gaze directions. Our solution can compensate for HMD shifts, even those arising from taking off the headset, which enables us to eliminate reinitialization steps.
@article{wrro175920,
volume = {91},
month = {October},
author = {P Shi and M Billeter and E Eisemann},
title = {SalientGaze: Saliency-based gaze correction in virtual reality},
publisher = {Elsevier},
doi = {10.1016/j.cag.2020.06.007},
journal = {Computers \& Graphics},
pages = {83--94},
year = {2020},
keywords = {Virtual reality; Eye-tracking; Headsets shifts; Saliency; Stereo; Drift estimation},
url = {https://eprints.whiterose.ac.uk/175920/},
abstract = {Eye-tracking with gaze estimation is a key element in many applications, ranging from foveated rendering and user interaction to behavioural analysis and usage metrics. For virtual reality, eye-tracking typically relies on near-eye cameras that are mounted in the VR headset. Such methods usually involve an initial calibration to create a mapping from eye features to a gaze position. However, the accuracy based on the initial calibration degrades when the position of the headset relative to the users? head changes; this is especially noticeable when users readjust the headset for comfort or even completely remove it for a short while. We show that a correction of such shifts can be achieved via 2D drift vectors in eye space. Our method estimates these drifts by extracting salient cues from the shown virtual environment to determine potential gaze directions. Our solution can compensate for HMD shifts, even those arising from taking off the headset, which enables us to eliminate reinitialization steps.}
}Human motion modelling is crucial in many areas such as computergraphics, vision and virtual reality. Acquiring high-quality skele-tal motions is difficult due to the need for specialized equipmentand laborious manual post-posting, which necessitates maximiz-ing the use of existing data to synthesize new data. However, it is a challenge due to the intrinsic motion stochasticity of humanmotion dynamics, manifested in the short and long terms. In theshort term, there is strong randomness within a couple frames, e.g.one frame followed by multiple possible frames leading to differentmotion styles; while in the long term, there are non-deterministicaction transitions. In this paper, we present Dynamic Future Net,a new deep learning model where we explicitly focuses on the aforementioned motion stochasticity by constructing a generative model with non-trivial modelling capacity in temporal stochas-ticity. Given limited amounts of data, our model can generate a large number of high-quality motions with arbitrary duration, andvisually-convincing variations in both space and time. We evaluateour model on a wide range of motions and compare it with the state-of-the-art methods. Both qualitative and quantitative results show the superiority of our method, for its robustness, versatility and high-quality.
@misc{wrro163776,
month = {October},
author = {W Chen and H Wang and Y Yuan and T Shao and K Zhou},
note = { {\copyright} 2020 ACM. This is an author produced version of a conference paper published in MM '20: Proceedings of the 28th ACM International Conference on Multimedia. Uploaded in accordance with the publisher's self-archiving policy.
},
booktitle = {ACM Multimedia 2020},
title = {Dynamic Future Net: Diversified Human Motion Generation},
publisher = {Association for Computing Machinery},
year = {2020},
journal = {MM '20: Proceedings of the 28th ACM International Conference on Multimedia},
pages = {2131--2139},
url = {https://eprints.whiterose.ac.uk/163776/},
abstract = {Human motion modelling is crucial in many areas such as computergraphics, vision and virtual reality. Acquiring high-quality skele-tal motions is difficult due to the need for specialized equipmentand laborious manual post-posting, which necessitates maximiz-ing the use of existing data to synthesize new data. However, it is a challenge due to the intrinsic motion stochasticity of humanmotion dynamics, manifested in the short and long terms. In theshort term, there is strong randomness within a couple frames, e.g.one frame followed by multiple possible frames leading to differentmotion styles; while in the long term, there are non-deterministicaction transitions. In this paper, we present Dynamic Future Net,a new deep learning model where we explicitly focuses on the aforementioned motion stochasticity by constructing a generative model with non-trivial modelling capacity in temporal stochas-ticity. Given limited amounts of data, our model can generate a large number of high-quality motions with arbitrary duration, andvisually-convincing variations in both space and time. We evaluateour model on a wide range of motions and compare it with the state-of-the-art methods. Both qualitative and quantitative results show the superiority of our method, for its robustness, versatility and high-quality.}
}Humans, in comparison to robots, are remarkably adept at reaching for objects in cluttered environments. The best existing robot planners are based on random sampling of configuration space- which becomes excessively high-dimensional with large number of objects. Consequently, most planners often fail to efficiently find object manipulation plans in such environments. We addressed this problem by identifying high-level manipulation plans in humans, and transferring these skills to robot planners. We used virtual reality to capture human participants reaching for a target object on a tabletop cluttered with obstacles. From this, we devised a qualitative representation of the task space to abstract the decision making, irrespective of the number of obstacles. Based on this representation, human demonstrations were segmented and used to train decision classifiers. Using these classifiers, our planner produced a list of waypoints in task space. These waypoints provided a high-level plan, which could be transferred to an arbitrary robot model and used to initialise a local trajectory optimiser. We evaluated this approach through testing on unseen human VR data, a physics-based robot simulation, and a real robot (dataset and code are publicly available 1 ). We found that the human-like planner outperformed a state-of-the-art standard trajectory optimisation algorithm, and was able to generate effective strategies for rapid planning- irrespective of the number of obstacles in the environment.
@misc{wrro158051,
month = {September},
author = {M Hasan and M Warburton and WC Agboh and MR Dogar and M Leonetti and H Wang and F Mushtaq and M Mon-Williams and AG Cohn},
note = {{\copyright} 2020, IEEE. This is an author produced version of a paper accepted for publication in 2020 International Conference on Robotics and Automation (ICRA). Personal use of this material is permitted. Permission from IEEE must be obtained for all other uses, in any current or future media, including reprinting/republishing this material for advertising or promotional purposes, creating new collective works, for resale or redistribution to servers or lists, or reuse of any copyrighted component of this work in other works. Uploaded in accordance with the publisher's self-archiving policy.},
booktitle = {ICRA 2020},
title = {Human-like Planning for Reaching in Cluttered Environments},
publisher = {IEEE},
year = {2020},
journal = {2020 IEEE International Conference on Robotics and Automation (ICRA)},
pages = {7784--7790},
keywords = {Task analysis; Planning; Robots; Testing; Feature extraction; Trajectory; Standards},
url = {https://eprints.whiterose.ac.uk/158051/},
abstract = {Humans, in comparison to robots, are remarkably adept at reaching for objects in cluttered environments. The best existing robot planners are based on random sampling of configuration space- which becomes excessively high-dimensional with large number of objects. Consequently, most planners often fail to efficiently find object manipulation plans in such environments. We addressed this problem by identifying high-level manipulation plans in humans, and transferring these skills to robot planners. We used virtual reality to capture human participants reaching for a target object on a tabletop cluttered with obstacles. From this, we devised a qualitative representation of the task space to abstract the decision making, irrespective of the number of obstacles. Based on this representation, human demonstrations were segmented and used to train decision classifiers. Using these classifiers, our planner produced a list of waypoints in task space. These waypoints provided a high-level plan, which could be transferred to an arbitrary robot model and used to initialise a local trajectory optimiser. We evaluated this approach through testing on unseen human VR data, a physics-based robot simulation, and a real robot (dataset and code are publicly available 1 ). We found that the human-like planner outperformed a state-of-the-art standard trajectory optimisation algorithm, and was able to generate effective strategies for rapid planning- irrespective of the number of obstacles in the environment.}
}Insect swarms are common phenomena in nature and therefore have been actively pursued in computer animation. Realistic insect swarm simulation is difficult due to two challenges: high?fidelity behaviors and large scales, which make the simulation practice subject to laborious manual work and excessive trial?and?error processes. To address both challenges, we present a novel data?driven framework, FASTSWARM, to model complex behaviors of flying insects based on real?world data and simulate plausible animations of flying insect swarms. FASTSWARM has a linear time complexity and achieves real?time performance for large swarms. The high?fidelity behavior model of FASTSWARM explicitly takes into consideration the most common behaviors of flying insects, including the interactions among insects such as repulsion and attraction, self?propelled behaviors such as target following and obstacle avoidance, and other characteristics such as random movements. To achieve scalability, an energy minimization problem is formed with different behaviors modeled as energy terms, where the minimizer is the desired behavior. The minimizer is computed from the real?world data, which ensures the plausibility of the simulation results. Extensive simulation results and evaluations show that FASTSWARM is versatile in simulating various swarm behaviors, high fidelity measured by various metrics, easily controllable in inducing user controls and highly scalable.
@article{wrro163467,
volume = {31},
number = {4-5},
month = {September},
author = {W Xiang and X Yao and H Wang and X Jin},
note = {{\copyright} 2020 John Wiley \& Sons, Ltd. This is the peer reviewed version of the following article: Xiang, W, Yao, X, Wang, H et al. (1 more author) (2020) FASTSWARM: A Data-driven FrAmework for Real-time Flying InSecT SWARM Simulation. Computer Animation and Virtual Worlds. e1957. ISSN 1546-4261, which has been published in final form at http://doi.org/10.1002/cav.1957. This article may be used for non-commercial purposes in accordance with Wiley Terms and Conditions for Use of Self-Archived Versions.},
title = {FASTSWARM: A Data-driven FrAmework for Real-time Flying InSecT SWARM Simulation},
publisher = {Wiley},
year = {2020},
journal = {Computer Animation and Virtual Worlds},
keywords = {collective behavior; data?driven; insect swarm simulation; optimization; real time},
url = {https://eprints.whiterose.ac.uk/163467/},
abstract = {Insect swarms are common phenomena in nature and therefore have been actively pursued in computer animation. Realistic insect swarm simulation is difficult due to two challenges: high?fidelity behaviors and large scales, which make the simulation practice subject to laborious manual work and excessive trial?and?error processes. To address both challenges, we present a novel data?driven framework, FASTSWARM, to model complex behaviors of flying insects based on real?world data and simulate plausible animations of flying insect swarms. FASTSWARM has a linear time complexity and achieves real?time performance for large swarms. The high?fidelity behavior model of FASTSWARM explicitly takes into consideration the most common behaviors of flying insects, including the interactions among insects such as repulsion and attraction, self?propelled behaviors such as target following and obstacle avoidance, and other characteristics such as random movements. To achieve scalability, an energy minimization problem is formed with different behaviors modeled as energy terms, where the minimizer is the desired behavior. The minimizer is computed from the real?world data, which ensures the plausibility of the simulation results. Extensive simulation results and evaluations show that FASTSWARM is versatile in simulating various swarm behaviors, high fidelity measured by various metrics, easily controllable in inducing user controls and highly scalable.}
}We present a novel spatial hashing based data structure to facilitate 3D shape analysis using convolutional neural networks (CNNs). Our method builds hierarchical hash tables for an input model under different resolutions that leverage the sparse occupancy of 3D shape boundary. Based on this data structure, we design two efficient GPU algorithms namely hash2col and col2hash so that the CNN operations like convolution and pooling can be efficiently parallelized. The perfect spatial hashing is employed as our spatial hashing scheme, which is not only free of hash collision but also nearly minimal so that our data structure is almost of the same size as the raw input. Compared with existing 3D CNN methods, our data structure significantly reduces the memory footprint during the CNN training. As the input geometry features are more compactly packed, CNN operations also run faster with our data structure. The experiment shows that, under the same network structure, our method yields comparable or better benchmark results compared with the state-of-the-art while it has only one-third memory consumption when under high resolutions (i.e. 256 3).
@article{wrro140897,
volume = {26},
number = {7},
month = {July},
author = {T Shao and Y Yang and Y Weng and Q Hou and K Zhou},
note = {{\copyright} 2018 IEEE. This is an author produced version of a paper published in IEEE Transactions on Visualization and Computer Graphics. Personal use of this material is permitted. Permission from IEEE must be obtained for all other uses, in any current or future media, including reprinting/republishing this material for advertising or promotional purposes, creating new collective works, for resale or redistribution to servers or lists, or reuse of any copyrighted component of this work in other works. Uploaded in accordance with the publisher's self-archiving policy.},
title = {H-CNN: Spatial Hashing Based CNN for 3D Shape Analysis},
publisher = {Institute of Electrical and Electronics Engineers},
year = {2020},
journal = {IEEE Transactions on Visualization and Computer Graphics},
pages = {2403--2416},
keywords = {perfect hashing , convolutional neural network , shape classification , shape retrieval , shape segmentation},
url = {https://eprints.whiterose.ac.uk/140897/},
abstract = {We present a novel spatial hashing based data structure to facilitate 3D shape analysis using convolutional neural networks (CNNs). Our method builds hierarchical hash tables for an input model under different resolutions that leverage the sparse occupancy of 3D shape boundary. Based on this data structure, we design two efficient GPU algorithms namely hash2col and col2hash so that the CNN operations like convolution and pooling can be efficiently parallelized. The perfect spatial hashing is employed as our spatial hashing scheme, which is not only free of hash collision but also nearly minimal so that our data structure is almost of the same size as the raw input. Compared with existing 3D CNN methods, our data structure significantly reduces the memory footprint during the CNN training. As the input geometry features are more compactly packed, CNN operations also run faster with our data structure. The experiment shows that, under the same network structure, our method yields comparable or better benchmark results compared with the state-of-the-art while it has only one-third memory consumption when under high resolutions (i.e. 256 3).}
}Crowd simulation is a central topic in several fields including graphics. To achieve high-fidelity simulations, data has been increasingly relied upon for analysis and simulation guidance. However, the information in real-world data is often noisy, mixed and unstructured, making it difficult for effective analysis, therefore has not been fully utilized. With the fast-growing volume of crowd data, such a bottleneck needs to be addressed. In this paper, we propose a new framework which comprehensively tackles this problem. It centers at an unsupervised method for analysis. The method takes as input raw and noisy data with highly mixed multi-dimensional (space, time and dynamics) information, and automatically structure it by learning the correlations among these dimensions. The dimensions together with their correlations fully describe the scene semantics which consists of recurring activity patterns in a scene, manifested as space flows with temporal and dynamics profiles. The effectiveness and robustness of the analysis have been tested on datasets with great variations in volume, duration, environment and crowd dynamics. Based on the analysis, new methods for data visualization, simulation evaluation and simulation guidance are also proposed. Together, our framework establishes a highly automated pipeline from raw data to crowd analysis, comparison and simulation guidance. Extensive experiments and evaluations have been conducted to show the flexibility, versatility and intuitiveness of our framework.
@article{wrro160067,
volume = {39},
number = {4},
month = {July},
author = {F He and Y Xiang and X Zhao and H Wang},
note = {Accepted in SIGGRAPH 2020. {\copyright} 2020 ACM. This is the author's version of the work. It is posted here for your personal use. Not for redistribution. The definitive Version of Record was published in ACM Transactions on Graphics, https://doi.org/10.1145/3386569.3392407.},
title = {Informative scene decomposition for crowd analysis, comparison and simulation guidance},
publisher = {Association for Computing Machinery (ACM)},
year = {2020},
journal = {ACM Transactions on Graphics},
url = {https://eprints.whiterose.ac.uk/160067/},
abstract = {Crowd simulation is a central topic in several fields including graphics. To achieve high-fidelity simulations, data has been increasingly relied upon for analysis and simulation guidance. However, the information in real-world data is often noisy, mixed and unstructured, making it difficult for effective analysis, therefore has not been fully utilized. With the fast-growing volume of crowd data, such a bottleneck needs to be addressed. In this paper, we propose a new framework which comprehensively tackles this problem. It centers at an unsupervised method for analysis. The method takes as input raw and noisy data with highly mixed multi-dimensional (space, time and dynamics) information, and automatically structure it by learning the correlations among these dimensions. The dimensions together with their correlations fully describe the scene semantics which consists of recurring activity patterns in a scene, manifested as space flows with temporal and dynamics profiles. The effectiveness and robustness of the analysis have been tested on datasets with great variations in volume, duration, environment and crowd dynamics. Based on the analysis, new methods for data visualization, simulation evaluation and simulation guidance are also proposed. Together, our framework establishes a highly automated pipeline from raw data to crowd analysis, comparison and simulation guidance. Extensive experiments and evaluations have been conducted to show the flexibility, versatility and intuitiveness of our framework.}
}We introduce a novel approach to automatic unstructured mesh generation using machine learning to predict an optimal finite element mesh for a previously unseen problem. The framework that we have developed is based around training an artificial neural network (ANN) to guide standard mesh generation software, based upon a prediction of the required local mesh density throughout the domain. We describe the training regime that is proposed, based upon the use of a posteriori error estimation, and discuss the topologies of the ANNs that we have considered. We then illustrate performance using two standard test problems, a single elliptic partial differential equation (PDE) and a system of PDEs associated with linear elasticity. We demonstrate the effective generation of high quality meshes for arbitrary polygonal geometries and a range of material parameters, using a variety of user-selected error norms.
@misc{wrro159526,
volume = {12139},
month = {June},
author = {Z Zhang and Y Wang and PK Jimack and H Wang},
note = {{\copyright} Springer Nature Switzerland AG 2020. This is an author produced version of a conference paper published inLecture Notes in Computer Science. Uploaded in accordance with the publisher's self-archiving policy.},
booktitle = {ICCS 2020: International Conference on Computational Science},
title = {MeshingNet: A New Mesh Generation Method based on Deep Learning},
publisher = {Springer Verlag},
year = {2020},
journal = {Lecture Notes in Computer Science},
pages = {186--198},
keywords = {Mesh generation; Error equidistribution; Machine learning; Artificial neural networks},
url = {https://eprints.whiterose.ac.uk/159526/},
abstract = {We introduce a novel approach to automatic unstructured mesh generation using machine learning to predict an optimal finite element mesh for a previously unseen problem. The framework that we have developed is based around training an artificial neural network (ANN) to guide standard mesh generation software, based upon a prediction of the required local mesh density throughout the domain. We describe the training regime that is proposed, based upon the use of a posteriori error estimation, and discuss the topologies of the ANNs that we have considered. We then illustrate performance using two standard test problems, a single elliptic partial differential equation (PDE) and a system of PDEs associated with linear elasticity. We demonstrate the effective generation of high quality meshes for arbitrary polygonal geometries and a range of material parameters, using a variety of user-selected error norms.}
}Voxels are a popular choice to encode complex geometry. Their regularity makes updates easy and enables random retrieval of values. The main limitation lies in the poor scaling with respect to resolution. Sparse voxel DAGs (Directed Acyclic Graphs) overcome this hurdle and offer high-resolution representations for real-time rendering but only handle static data. We introduce a novel data structure to enable interactive modifications of such compressed voxel geometry without requiring de- and recompression. Besides binary data to encode geometry, it also supports compressed attributes (e.g., color). We illustrate the usefulness of our representation via an interactive large-scale voxel editor (supporting carving, filling, copying, and painting).
@article{wrro179723,
volume = {39},
number = {2},
month = {May},
author = {V Careil and M Billeter and E Eisemann},
title = {Interactively Modifying Compressed Sparse Voxel Representations},
publisher = {Wiley},
doi = {10.1111/cgf.13916},
year = {2020},
journal = {Computer Graphics Forum},
pages = {111--119},
keywords = {CCS Concepts; . Computing methodologies -{\ensuremath{>}} Volumetric models},
url = {https://eprints.whiterose.ac.uk/179723/},
abstract = {Voxels are a popular choice to encode complex geometry. Their regularity makes updates easy and enables random retrieval of values. The main limitation lies in the poor scaling with respect to resolution. Sparse voxel DAGs (Directed Acyclic Graphs) overcome this hurdle and offer high-resolution representations for real-time rendering but only handle static data. We introduce a novel data structure to enable interactive modifications of such compressed voxel geometry without requiring de- and recompression. Besides binary data to encode geometry, it also supports compressed attributes (e.g., color). We illustrate the usefulness of our representation via an interactive large-scale voxel editor (supporting carving, filling, copying, and painting).}
}NNWarp is a highly re-usable and efficient neural network (NN) based nonlinear deformable simulation framework. Unlike other machine learning applications such as image recognition, where different inputs have a uniform and consistent format (e.g. an array of all the pixels in an image), the input for deformable simulation is quite variable, high-dimensional, and parametrization-unfriendly. Consequently, even though the neural network is known for its rich expressivity of nonlinear functions, directly using an NN to reconstruct the force-displacement relation for general deformable simulation is nearly impossible. NNWarp obviates this difficulty by partially restoring the force-displacement relation via warping the nodal displacement simulated using a simplistic constitutive model - the linear elasticity. In other words, NNWarp yields an incremental displacement fix per mesh node based on a simplified (therefore incorrect) simulation result other than synthesizing the unknown displacement directly. We introduce a compact yet effective feature vector including geodesic, potential and digression to sort training pairs of per-node linear and nonlinear displacement. NNWarp is robust under different model shapes and tessellations. With the assistance of deformation substructuring, one NN training is able to handle a wide range of 3D models of various geometries. Thanks to the linear elasticity and its constant system matrix, the underlying simulator only needs to perform one pre-factorized matrix solve at each time step, which allows NNWarp to simulate large models in real time.
@article{wrro140899,
volume = {26},
number = {4},
month = {April},
author = {R Luo and T Shao and H Wang and W Xu and X Chen and K Zhou and Y Yang},
note = {{\copyright} 2018 IEEE. This is an author produced version of a paper published in IEEE Transactions on Visualization and Computer Graphics. Personal use of this material is permitted. Permission from IEEE must be obtained for all other uses, in any current or future media, including reprinting/republishing this material for advertising or promotional purposes, creating new collective works, for resale or redistribution to servers or lists, or reuse of any copyrighted component of this work in other works. Uploaded in accordance with the publisher's self-archiving policy.},
title = {NNWarp: Neural Network-based Nonlinear Deformation},
publisher = {Institute of Electrical and Electronics Engineers},
year = {2020},
journal = {IEEE Transactions on Visualization and Computer Graphics},
pages = {1745--1759},
keywords = {neural network , machine learning , data-driven animation , nonlinear regression , deformable model , physics-based simulation},
url = {https://eprints.whiterose.ac.uk/140899/},
abstract = {NNWarp is a highly re-usable and efficient neural network (NN) based nonlinear deformable simulation framework. Unlike other machine learning applications such as image recognition, where different inputs have a uniform and consistent format (e.g. an array of all the pixels in an image), the input for deformable simulation is quite variable, high-dimensional, and parametrization-unfriendly. Consequently, even though the neural network is known for its rich expressivity of nonlinear functions, directly using an NN to reconstruct the force-displacement relation for general deformable simulation is nearly impossible. NNWarp obviates this difficulty by partially restoring the force-displacement relation via warping the nodal displacement simulated using a simplistic constitutive model - the linear elasticity. In other words, NNWarp yields an incremental displacement fix per mesh node based on a simplified (therefore incorrect) simulation result other than synthesizing the unknown displacement directly. We introduce a compact yet effective feature vector including geodesic, potential and digression to sort training pairs of per-node linear and nonlinear displacement. NNWarp is robust under different model shapes and tessellations. With the assistance of deformation substructuring, one NN training is able to handle a wide range of 3D models of various geometries. Thanks to the linear elasticity and its constant system matrix, the underlying simulator only needs to perform one pre-factorized matrix solve at each time step, which allows NNWarp to simulate large models in real time.}
}This paper presents a fully automatic framework for extracting editable 3D objects directly from a single photograph. Unlike previous methods which recover either depth maps, point clouds, or mesh surfaces, we aim to recover 3D objects with semantic parts and can be directly edited. We base our work on the assumption that most human-made objects are constituted by parts and these parts can be well represented by generalized primitives. Our work makes an attempt towards recovering two types of primitive-shaped objects, namely, generalized cuboids and generalized cylinders. To this end, we build a novel instance-aware segmentation network for accurate part separation. Our GeoNet outputs a set of smooth part-level masks labeled as profiles and bodies. Then in a key stage, we simultaneously identify profile-body relations and recover 3D parts by sweeping the recognized profile along their body contour and jointly optimize the geometry to align with the recovered masks. Qualitative and quantitative experiments show that our algorithm can recover high quality 3D models and outperforms existing methods in both instance segmentation and 3D reconstruction.
@article{wrro138568,
volume = {26},
number = {3},
month = {March},
author = {X Chen and Y Li and X Luo and T Shao and J Yu and K Zhou and Y Zheng},
note = { {\copyright} 2018 IEEE. Personal use of this material is permitted. Permission from IEEE must be obtained for all other uses, in any current or future media, including reprinting/republishing this material for advertising or promotional purposes, creating new collective works, for resale or redistribution to servers or lists, or reuse of any copyrighted component of this work in other works.},
title = {AutoSweep: Recovering 3D Editable Objects from a Single Photograph},
publisher = {Institute of Electrical and Electronics Engineers},
year = {2020},
journal = {IEEE Transactions on Visualization and Computer Graphics},
pages = {1466--1475},
keywords = {Editable objects; instance-aware segmentation; sweep surfaces},
url = {https://eprints.whiterose.ac.uk/138568/},
abstract = {This paper presents a fully automatic framework for extracting editable 3D objects directly from a single photograph. Unlike previous methods which recover either depth maps, point clouds, or mesh surfaces, we aim to recover 3D objects with semantic parts and can be directly edited. We base our work on the assumption that most human-made objects are constituted by parts and these parts can be well represented by generalized primitives. Our work makes an attempt towards recovering two types of primitive-shaped objects, namely, generalized cuboids and generalized cylinders. To this end, we build a novel instance-aware segmentation network for accurate part separation. Our GeoNet outputs a set of smooth part-level masks labeled as profiles and bodies. Then in a key stage, we simultaneously identify profile-body relations and recover 3D parts by sweeping the recognized profile along their body contour and jointly optimize the geometry to align with the recovered masks. Qualitative and quantitative experiments show that our algorithm can recover high quality 3D models and outperforms existing methods in both instance segmentation and 3D reconstruction.}
}Healthcare organizations worldwide use quality dashboards to provide feedback to clinical teams and managers, in order to monitor care quality and stimulate quality improvement. However, there is limited evidence regarding the impact of quality dashboards and audit and feedback research focuses on feedback to individual clinicians, rather than to clinical and managerial teams. Consequently, we know little about what features a quality dashboard needs in order to provide benefit. We conducted 54 interviews across five healthcare organizations in the National Health Service in England, interviewing personnel at different levels of the organization, to understand how national (UK) clinical audit data are used for quality improvement and factors that support or constrain use of these data. The findings, organized around the themes of choosing performance indicators, assessing performance, identifying causes, communicating from ward to board, and data quality, have implications for the design of quality dashboards, which we have translated into a series of requirements.
@misc{wrro156817,
volume = {2019},
month = {March},
author = {R Randell and N Alvarado and L McVey and RA Ruddle and P Doherty and C Gale and M Mamas and D Dowding},
note = {This is an author produced version of a conference paper published in AMIA Annual Symposium Proceedings. Uploaded with permission from the publisher.},
booktitle = {AMIA 2019 Annual Symposium},
title = {Requirements for a quality dashboard: Lessons from National Clinical Audits},
publisher = {American Medical Informatics Association},
year = {2020},
journal = {AMIA Annual Symposium Proceedings},
pages = {735--744},
url = {https://eprints.whiterose.ac.uk/156817/},
abstract = {Healthcare organizations worldwide use quality dashboards to provide feedback to clinical teams and managers, in order to monitor care quality and stimulate quality improvement. However, there is limited evidence regarding the impact of quality dashboards and audit and feedback research focuses on feedback to individual clinicians, rather than to clinical and managerial teams. Consequently, we know little about what features a quality dashboard needs in order to provide benefit. We conducted 54 interviews across five healthcare organizations in the National Health Service in England, interviewing personnel at different levels of the organization, to understand how national (UK) clinical audit data are used for quality improvement and factors that support or constrain use of these data. The findings, organized around the themes of choosing performance indicators, assessing performance, identifying causes, communicating from ward to board, and data quality, have implications for the design of quality dashboards, which we have translated into a series of requirements.}
}Introduction: National audits are used to monitor care quality and safety and are anticipated to reduce unexplained variations in quality by stimulating quality improvement (QI). However, variation within and between providers in the extent of engagement with national audits means that the potential for national audit data to inform QI is not being realised. This study will undertake a feasibility evaluation of QualDash, a quality dashboard designed to support clinical teams and managers to explore data from two national audits, the Myocardial Ischaemia National Audit Project (MINAP) and the Paediatric Intensive Care Audit Network (PICANet). Methods and analysis: Realist evaluation, which involves building, testing and refining theories of how an intervention works, provides an overall framework for this feasibility study. Realist hypotheses that describe how, in what contexts, and why QualDash is expected to provide benefit will be tested across five hospitals. A controlled interrupted time series analysis, using key MINAP and PICANet measures, will provide preliminary evidence of the impact of QualDash, while ethnographic observations and interviews over 12 months will provide initial insight into contexts and mechanisms that lead to those impacts. Feasibility outcomes include the extent to which MINAP and PICANet data are used, data completeness in the audits, and the extent to which participants perceive QualDash to be useful and express the intention to continue using it after the study period. Ethics and dissemination: The study has been approved by the University of Leeds School of Healthcare Research Ethics Committee. Study results will provide an initial understanding of how, in what contexts, and why quality dashboards lead to improvements in care quality. These will be disseminated to academic audiences, study participants, hospital IT departments and national audits. If the results show a trial is feasible, we will disseminate the QualDash software through a stepped wedge cluster randomised trial.
@article{wrro156818,
volume = {10},
number = {2},
month = {February},
author = {R Randell and N Alvarado and L McVey and J Greenhalgh and RM West and A Farrin and C Gale and R Parslow and J Keen and M Elshehaly and RA Ruddle and J Lake and M Mamas and R Feltbower and D Dowding},
note = {{\copyright} Author(s) (or their employer(s)) 2020. Re-use permitted under CC BY. Published by BMJ. This is an open access article distributed in accordance with the Creative Commons Attribution 4.0 Unported (CC BY 4.0) license, which permits others to copy, redistribute, remix, transform and build upon this work for any purpose, provided the original work is properly cited, a link to the licence is given, and indication of whether changes were made. See: https://creativecommons.org/licenses/by/4.0/.},
title = {How, in what contexts, and why do quality dashboards lead to improvements in care quality in acute hospitals? Protocol for a realist feasibility evaluation},
publisher = {BMJ Publishing Group},
year = {2020},
journal = {BMJ Open},
url = {https://eprints.whiterose.ac.uk/156818/},
abstract = {Introduction: National audits are used to monitor care quality and safety and are anticipated to reduce unexplained variations in quality by stimulating quality improvement (QI). However, variation within and between providers in the extent of engagement with national audits means that the potential for national audit data to inform QI is not being realised. This study will undertake a feasibility evaluation of QualDash, a quality dashboard designed to support clinical teams and managers to explore data from two national audits, the Myocardial Ischaemia National Audit Project (MINAP) and the Paediatric Intensive Care Audit Network (PICANet).
Methods and analysis: Realist evaluation, which involves building, testing and refining theories of how an intervention works, provides an overall framework for this feasibility study. Realist hypotheses that describe how, in what contexts, and why QualDash is expected to provide benefit will be tested across five hospitals. A controlled interrupted time series analysis, using key MINAP and PICANet measures, will provide preliminary evidence of the impact of QualDash, while ethnographic observations and interviews over 12 months will provide initial insight into contexts and mechanisms that lead to those impacts. Feasibility outcomes include the extent to which MINAP and PICANet data are used, data completeness in the audits, and the extent to which participants perceive QualDash to be useful and express the intention to continue using it after the study period.
Ethics and dissemination: The study has been approved by the University of Leeds School of Healthcare Research Ethics Committee. Study results will provide an initial understanding of how, in what contexts, and why quality dashboards lead to improvements in care quality. These will be disseminated to academic audiences, study participants, hospital IT departments and national audits. If the results show a trial is feasible, we will disseminate the QualDash software through a stepped wedge cluster randomised trial.}
}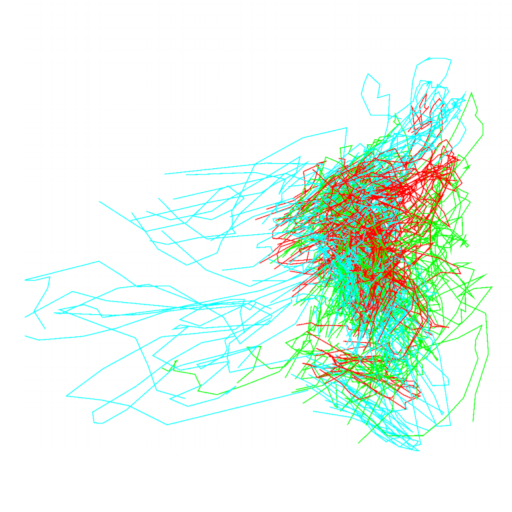
Emotion is considered to be a core element in performances. In computer animation, both body motions and facial expressions are two popular mediums for a character to express the emotion. However, there has been limited research in studying how to effectively synthesize these two types of character movements using different levels of emotion strength with intuitive control, which is difficult to be modeled effectively. In this work, we explore a common model that can be used to represent the emotion for the applications of body motions and facial expressions synthesis. Unlike previous work that encode emotions into discrete motion style descriptors, we propose a continuous control indicator called emotion strength by controlling which a data?driven approach is presented to synthesize motions with fine control over emotions. Rather than interpolating motion features to synthesize new motion as in existing work, our method explicitly learns a model mapping low?level motion features to the emotion strength. Because the motion synthesis model is learned in the training stage, the computation time required for synthesizing motions at run time is very low. We further demonstrate the generality of our proposed framework by editing 2D face images using relative emotion strength. As a result, our method can be applied to interactive applications such as computer games, image editing tools, and virtual reality applications, as well as offline applications such as animation and movie production.
@article{wrro144010,
volume = {30},
number = {6},
month = {November},
author = {JCP Chan and HPH Shum and H Wang and L Yi and W Wei and ESL Ho},
note = {{\copyright} 2019 John Wiley \& Sons, Ltd. This is the peer reviewed version of the following article: Chan, JCP, Shum, HPH, Wang, H et al. (3 more authors) (2019) A generic framework for editing and synthesizing multimodal data with relative emotion strength. Computer Animation and Virtual Worlds. e1871. ISSN 1546-4261, which has been published in final form at https://doi.org/10.1002/cav.1871. This article may be used for non-commercial purposes in accordance with Wiley Terms and Conditions for Use of Self-Archived Versions.},
title = {A generic framework for editing and synthesizing multimodal data with relative emotion strength},
publisher = {Wiley},
year = {2019},
journal = {Computer Animation and Virtual Worlds},
keywords = {data?driven; emotion motion; facial expression; image editing; motion capture; motion synthesis; relative attribute},
url = {https://eprints.whiterose.ac.uk/144010/},
abstract = {Emotion is considered to be a core element in performances. In computer animation, both body motions and facial expressions are two popular mediums for a character to express the emotion. However, there has been limited research in studying how to effectively synthesize these two types of character movements using different levels of emotion strength with intuitive control, which is difficult to be modeled effectively. In this work, we explore a common model that can be used to represent the emotion for the applications of body motions and facial expressions synthesis. Unlike previous work that encode emotions into discrete motion style descriptors, we propose a continuous control indicator called emotion strength by controlling which a data?driven approach is presented to synthesize motions with fine control over emotions. Rather than interpolating motion features to synthesize new motion as in existing work, our method explicitly learns a model mapping low?level motion features to the emotion strength. Because the motion synthesis model is learned in the training stage, the computation time required for synthesizing motions at run time is very low. We further demonstrate the generality of our proposed framework by editing 2D face images using relative emotion strength. As a result, our method can be applied to interactive applications such as computer games, image editing tools, and virtual reality applications, as well as offline applications such as animation and movie production.}
}A camera's shutter controls the incoming light that is reaching the camera sensor. Different shutters lead to wildly different results, and are often used as a tool in movies for artistic purpose, e.g., they can indirectly control the effect of motion blur. However, a physical camera is limited to a single shutter setting at any given moment. ShutterApp enables users to define spatio-temporally-varying virtual shutters that go beyond the options available in real-world camera systems. A user provides a sparse set of annotations that define shutter functions at selected locations in key frames. From this input, our solution defines shutter functions for each pixel of the video sequence using a suitable interpolation technique, which are then employed to derive the output video. Our solution performs in real-time on commodity hardware. Hereby, users can explore different options interactively, leading to a new level of expressiveness without having to rely on specialized hardware or laborious editing.
@article{wrro179724,
volume = {38},
number = {7},
month = {October},
author = {NZ Salamon and M Billeter and E Eisemann},
title = {ShutterApp: Spatio-temporal Exposure Control for Videos},
publisher = {Wiley},
doi = {10.1111/cgf.13870},
year = {2019},
journal = {Computer Graphics Forum},
pages = {675--683},
url = {https://eprints.whiterose.ac.uk/179724/},
abstract = {A camera's shutter controls the incoming light that is reaching the camera sensor. Different shutters lead to wildly different results, and are often used as a tool in movies for artistic purpose, e.g., they can indirectly control the effect of motion blur. However, a physical camera is limited to a single shutter setting at any given moment. ShutterApp enables users to define spatio-temporally-varying virtual shutters that go beyond the options available in real-world camera systems. A user provides a sparse set of annotations that define shutter functions at selected locations in key frames. From this input, our solution defines shutter functions for each pixel of the video sequence using a suitable interpolation technique, which are then employed to derive the output video. Our solution performs in real-time on commodity hardware. Hereby, users can explore different options interactively, leading to a new level of expressiveness without having to rely on specialized hardware or laborious editing.}
}Background: It is clinically important to develop innovative techniques that can accurately measure blood pressures (BP) automatically. Objectives: This study aimed to present and evaluate a novel automatic BP measurement method based on deep learning method, and to confirm the effects on measured BPs of the position and contact pressure of stethoscope. Methods: 30 healthy subjects were recruited. 9 BP measurements (from three different stethoscope contact pressures and three repeats) were performed on each subject. The convolutional neural network (CNN) was designed and trained to identify the Korotkoff sounds at a beat-by-beat level. Next, a mapping algorithm was developed to relate the identified Korotkoff beats to the corresponding cuff pressures for systolic and diastolic BP (SBP and DBP) determinations. Its performance was evaluated by investigating the effects of the position and contact pressure of stethoscope on measured BPs in comparison with reference manual auscultatory method. Results: The overall measurement errors of the proposed method were 1.4 {$\pm$} 2.4 mmHg for SBP and 3.3 {$\pm$} 2.9 mmHg for DBP from all the measurements. In addition, the method demonstrated that there were small SBP differences between the 2 stethoscope positions, respectively at the 3 stethoscope contact pressures, and that DBP from the stethoscope under the cuff was significantly lower than that from outside the cuff by 2.0 mmHg (P {\ensuremath{<}} 0.01). Conclusion: Our findings suggested that the deep learning based method was an effective technique to measure BP, and could be developed further to replace the current oscillometric based automatic blood pressure measurement method.
@article{wrro146865,
volume = {128},
month = {August},
author = {F Pan and P He and F Chen and J Zhang and H Wang and D Zheng},
note = {{\copyright} 2019 Elsevier B.V. All rights reserved. This is an author produced version of a paper published in the International Journal of Medical Informatics . Uploaded in accordance with the publisher's self-archiving policy.},
title = {A novel deep learning based automatic auscultatory method to measure blood pressure},
publisher = {Elsevier},
year = {2019},
journal = {International Journal of Medical Informatics},
pages = {71--78},
keywords = {Blood pressure measurement; Convolutional neural network; Manual auscultatory method; Stethoscope position; Stethoscope contact pressure},
url = {https://eprints.whiterose.ac.uk/146865/},
abstract = {Background: It is clinically important to develop innovative techniques that can accurately measure blood pressures (BP) automatically. Objectives: This study aimed to present and evaluate a novel automatic BP measurement method based on deep learning method, and to confirm the effects on measured BPs of the position and contact pressure of stethoscope. Methods: 30 healthy subjects were recruited. 9 BP measurements (from three different stethoscope contact pressures and three repeats) were performed on each subject. The convolutional neural network (CNN) was designed and trained to identify the Korotkoff sounds at a beat-by-beat level. Next, a mapping algorithm was developed to relate the identified Korotkoff beats to the corresponding cuff pressures for systolic and diastolic BP (SBP and DBP) determinations. Its performance was evaluated by investigating the effects of the position and contact pressure of stethoscope on measured BPs in comparison with reference manual auscultatory method. Results: The overall measurement errors of the proposed method were 1.4 {$\pm$} 2.4 mmHg for SBP and 3.3 {$\pm$} 2.9 mmHg for DBP from all the measurements. In addition, the method demonstrated that there were small SBP differences between the 2 stethoscope positions, respectively at the 3 stethoscope contact pressures, and that DBP from the stethoscope under the cuff was significantly lower than that from outside the cuff by 2.0 mmHg (P {\ensuremath{<}} 0.01). Conclusion: Our findings suggested that the deep learning based method was an effective technique to measure BP, and could be developed further to replace the current oscillometric based automatic blood pressure measurement method.}
}Most researchers use a single method of mining to analyze event data. This paper uses case studies from two very different domains (electronic health records and cybersecurity) to investigate how researchers can gain breakthrough insights by combining multiple event mining methods in a visual analytics workflow. The aim of the health case study was to identify patterns of missing values, which was daunting because the 615 million missing values occurred in 43,219 combinations of fields. However, a workflow that involved exclusive set intersections (ESI), frequent itemset mining (FIM) and then two more ESI steps allowed us to identify that 82\% of the missing values were from just 244 combinations. The cybersecurity case study's aim was to understand users' behavior from logs that contained 300 types of action, gathered from 15,000 sessions and 1,400 users. Sequential frequent pattern mining (SFPM) and ESI highlighted some patterns in common, and others that were not. For the latter, SFPM stood out for its ability to action sequences that were buried within otherwise different sessions, and ESI detected subtle signals that were missed by SFPM. In summary, this paper demonstrates the importance of using multiple perspectives, complementary set mining methods and a diverse workflow when using visual analytics to analyze complex event data.
@misc{wrro147228,
month = {June},
author = {M Adnan and PH Nguyen and RA Ruddle and C Turkay},
note = {{\copyright} 2019 by the Eurographics Association. This is an author produced version of a conference paper published in EuroVis Workshop on Visual Analytics (EuroVA) 2019. Uploaded in accordance with the publisher's self-archiving policy. },
booktitle = {EuroVis Workshop on Visual Analytics (EuroVA) 2019},
editor = {C Turkay and T von Landesberger},
title = {Visual Analytics of Event Data using Multiple Mining Methods},
publisher = {The Eurographics Association},
year = {2019},
journal = {EuroVis Workshop on Visual Analytics (EuroVA) 2019},
pages = {61--65},
url = {https://eprints.whiterose.ac.uk/147228/},
abstract = {Most researchers use a single method of mining to analyze event data. This paper uses case studies from two very different domains (electronic health records and cybersecurity) to investigate how researchers can gain breakthrough insights by combining multiple event mining methods in a visual analytics workflow. The aim of the health case study was to identify patterns of missing values, which was daunting because the 615 million missing values occurred in 43,219 combinations of fields. However, a workflow that involved exclusive set intersections (ESI), frequent itemset mining (FIM) and then two more ESI steps allowed us to identify that 82\% of the missing values were from just 244 combinations. The cybersecurity case study's aim was to understand users' behavior from logs that contained 300 types of action, gathered from 15,000 sessions and 1,400 users. Sequential frequent pattern mining (SFPM) and ESI highlighted some patterns in common, and others that were not. For the latter, SFPM stood out for its ability to action sequences that were buried within otherwise different sessions, and ESI detected subtle signals that were missed by SFPM. In summary, this paper demonstrates the importance of using multiple perspectives, complementary set mining methods and a diverse workflow when using visual analytics to analyze complex event data.}
}In this design study, we present a visualization technique that segments patients' histories instead of treating them as raw event sequences, aggregates the segments using criteria such as the whole history or treatment combinations, and then visualizes the aggregated segments as static dashboards that are arranged in a dashboard network to show longitudinal changes. The static dashboards were developed in nine iterations, to show 15 important attributes from the patients' histories. The final design was evaluated with five non-experts, five visualization experts and four medical experts, who successfully used it to gain an overview of a 2,000 patient dataset, and to make observations about longitudinal changes and differences between two cohorts. The research represents a step-change in the detail of large-scale data that may be successfully visualized using dashboards, and provides guidance about how the approach may be generalized.
@article{wrro128739,
volume = {25},
number = {3},
month = {March},
author = {J Bernard and D Sessler and J Kohlhammer and RA Ruddle},
note = {{\copyright} 2018, IEEE. This is an author produced version of a paper published in IEEE Transactions on Visualization and Computer Graphics. Personal use of this material is permitted. Permission from IEEE must be obtained for all other uses, in any current or future media, including reprinting/republishing this material for advertising or promotional purposes, creating new collective works, for resale or redistribution to servers or lists, or reuse of any copyrighted component of this work in other works. Uploaded in accordance with the publisher?s self-archiving policy.},
title = {Using Dashboard Networks to Visualize Multiple Patient Histories: A Design Study on Post-operative Prostate Cancer},
publisher = {Institute of Electrical and Electronics Engineers (IEEE)},
year = {2019},
journal = {IEEE Transactions on Visualization and Computer Graphics},
pages = {1615--1628},
keywords = {Information Visualization, Visual Analytics, Multivariate Data Visualization, Electronic Health Care Records, Medical Data Analysis, Prostate Cancer Disease, Design Study, User Study, Evaluation, Static Dashboard, Dashboard Network},
url = {https://eprints.whiterose.ac.uk/128739/},
abstract = {In this design study, we present a visualization technique that segments patients' histories instead of treating them as raw event sequences, aggregates the segments using criteria such as the whole history or treatment combinations, and then visualizes the aggregated segments as static dashboards that are arranged in a dashboard network to show longitudinal changes. The static dashboards were developed in nine iterations, to show 15 important attributes from the patients' histories. The final design was evaluated with five non-experts, five visualization experts and four medical experts, who successfully used it to gain an overview of a 2,000 patient dataset, and to make observations about longitudinal changes and differences between two cohorts. The research represents a step-change in the detail of large-scale data that may be successfully visualized using dashboards, and provides guidance about how the approach may be generalized.}
}Descriptive statistics are typically presented as text, but that quickly becomes overwhelming when datasets contain many variables or analysts need to compare multiple datasets. Visualization offers a solution, but is rarely used apart from to show cardinalities (e.g., the \% missing values) or distributions of a small set of variables. This paper describes dataset- and variable-centric designs for visualizing three categories of descriptive statistic (cardinalities, distributions and patterns), which scale to more than 100 variables, and use multiple channels to encode important semantic differences (e.g., zero vs. 1+ missing values). We evaluated our approach using large (multi-million record) primary and secondary care datasets. The miniature visualizations provided our users with a variety of important insights, including differences in character patterns that indicate data validation issues, missing values for a variable that should always be complete, and inconsistent encryption of patient identifiers. Finally, we highlight the need for research into methods of identifying anomalies in the distributions of dates in health data.
@misc{wrro140847,
author = {R Ruddle and M Hall},
note = {This is an author produced version of a paper accepted for publication in the Proceedings of the 12th International Joint Conference on Biomedical Engineering Systems and Technologies.},
booktitle = {HEALTHINF 2019},
title = {Using Miniature Visualizations of Descriptive Statistics to Investigate the Quality of Electronic Health Records},
publisher = {SciTePress},
journal = {Proceedings of the 12th International Joint Conference on Biomedical Engineering Systems and Technologies - Volume 5: HEALTHINF},
pages = {230--238},
year = {2019},
keywords = {Data Visualization; Electronic Health Records; Data Quality},
url = {https://eprints.whiterose.ac.uk/140847/},
abstract = {Descriptive statistics are typically presented as text, but that quickly becomes overwhelming when datasets contain many variables or analysts need to compare multiple datasets. Visualization offers a solution, but is rarely used apart from to show cardinalities (e.g., the \% missing values) or distributions of a small set of variables. This paper describes dataset- and variable-centric designs for visualizing three categories of descriptive statistic (cardinalities, distributions and patterns), which scale to more than 100 variables, and use multiple channels to encode important semantic differences (e.g., zero vs. 1+ missing values). We evaluated our approach using large (multi-million record) primary and secondary care datasets. The miniature visualizations provided our users with a variety of important insights, including differences in character patterns that indicate data validation issues, missing values for a variable that should always be complete, and inconsistent encryption of patient identifiers. Finally, we highlight the need for research into methods of identifying anomalies in the distributions of dates in health data.}
}This paper introduces a novel method for realtime portrait animation in a single photo. Our method requires only a single portrait photo and a set of facial landmarks derived from a driving source (e.g., a photo or a video sequence), and generates an animated image with rich facial details. The core of our method is a warp-guided generative model that instantly fuses various fine facial details (e.g., creases and wrinkles), which are necessary to generate a high-fidelity facial expression, onto a pre-warped image. Our method factorizes out the nonlinear geometric transformations exhibited in facial expressions by lightweight 2D warps and leaves the appearance detail synthesis to conditional generative neural networks for high-fidelity facial animation generation. We show such a factorization of geometric transformation and appearance synthesis largely helps the network better learn the high nonlinearity of the facial expression functions and also facilitates the design of the network architecture. Through extensive experiments on various portrait photos from the Internet, we show the significant efficacy of our method compared with prior arts.
@article{wrro138578,
volume = {37},
number = {6},
month = {November},
author = {J Geng and T Shao and Y Zheng and Y Weng and K Zhou},
note = {{\copyright} 2018 Copyright held by the owner/author(s). Publication rights licensed to ACM. This is the author?s version of the work. It is posted here for your personal use. Not for redistribution. The definitive Version of Record was published in ACM Transactions on Graphics, https://doi.org/10.1145/3272127.3275043.},
title = {Warp-Guided GANs for Single-Photo Facial Animation},
publisher = {Association for Computing Machinery},
year = {2018},
journal = {ACM Transactions on Graphics},
url = {https://eprints.whiterose.ac.uk/138578/},
abstract = {This paper introduces a novel method for realtime portrait animation in a single photo. Our method requires only a single portrait photo and a set of facial landmarks derived from a driving source (e.g., a photo or a video sequence), and generates an animated image with rich facial details. The core of our method is a warp-guided generative model that instantly fuses various fine facial details (e.g., creases and wrinkles), which are necessary to generate a high-fidelity facial expression, onto a pre-warped image. Our method factorizes out the nonlinear geometric transformations exhibited in facial expressions by lightweight 2D warps and leaves the appearance detail synthesis to conditional generative neural networks for high-fidelity facial animation generation. We show such a factorization of geometric transformation and appearance synthesis largely helps the network better learn the high nonlinearity of the facial expression functions and also facilitates the design of the network architecture. Through extensive experiments on various portrait photos from the Internet, we show the significant efficacy of our method compared with prior arts.}
}In the paper, we propose an efficient algorithm for the surface voxelization of 3D geometrically complex models. Unlike recent techniques relying on triangle-voxel intersection tests, our algorithm exploits the conventional parallel-scanline strategy. Observing that there does not exist an optimal scanline interval in general 3D cases if one wants to use parallel voxelized scanlines to cover the interior of a triangle, we subdivide a triangle into multiple axis-aligned slices and carry out the scanning within each polygonal slice. The theoretical optimal scanline interval can be obtained to maximize the efficiency of the algorithm without missing any voxels on the triangle. Once the collection of scanlines are determined and voxelized, we obtain the surface voxelization. We fine tune the algorithm so that it only involves a few operations of integer additions and comparisons for each voxel generated. Finally, we comprehensively compare our method with the state-of-the-art method in terms of theoretical complexity, runtime performance and the quality of the voxelization on both CPU and GPU of a regular desktop PC, as well as on a mobile device. The results show that our method outperforms the existing method, especially when the resolution of the voxelization is high.
@article{wrro134272,
volume = {100},
month = {November},
author = {Y Zhang and S Garcia and W Xu and T Shao and Y Yang},
note = {{\copyright} 2017 Elsevier Inc. All rights reserved. This is an author produced version of a paper published in Graphical Models. Uploaded in accordance with the publisher's self-archiving policy},
title = {Efficient voxelization using projected optimal scanline},
publisher = {Elsevier},
year = {2018},
journal = {Graphical Models},
pages = {61--70},
keywords = {3D voxelization; Scanline; Integer arithmetic; Bresenham?s algorithm},
url = {https://eprints.whiterose.ac.uk/134272/},
abstract = {In the paper, we propose an efficient algorithm for the surface voxelization of 3D geometrically complex models. Unlike recent techniques relying on triangle-voxel intersection tests, our algorithm exploits the conventional parallel-scanline strategy. Observing that there does not exist an optimal scanline interval in general 3D cases if one wants to use parallel voxelized scanlines to cover the interior of a triangle, we subdivide a triangle into multiple axis-aligned slices and carry out the scanning within each polygonal slice. The theoretical optimal scanline interval can be obtained to maximize the efficiency of the algorithm without missing any voxels on the triangle. Once the collection of scanlines are determined and voxelized, we obtain the surface voxelization. We fine tune the algorithm so that it only involves a few operations of integer additions and comparisons for each voxel generated. Finally, we comprehensively compare our method with the state-of-the-art method in terms of theoretical complexity, runtime performance and the quality of the voxelization on both CPU and GPU of a regular desktop PC, as well as on a mobile device. The results show that our method outperforms the existing method, especially when the resolution of the voxelization is high.}
}This paper presents a novel system that enables a fully automatic modeling of both 3D geometry and functionality of a mechanism assembly from a single RGB image. The resulting 3D mechanism model highly resembles the one in the input image with the geometry, mechanical attributes, connectivity, and functionality of all the mechanical parts prescribed in a physically valid way. This challenging task is realized by combining various deep convolutional neural networks to provide high?quality and automatic part detection, segmentation, camera pose estimation and mechanical attributes retrieval for each individual part component. On the top of this, we use a local/global optimization algorithm to establish geometric interdependencies among all the parts while retaining their desired spatial arrangement. We use an interaction graph to abstract the inter?part connection in the resulting mechanism system. If an isolated component is identified in the graph, our system enumerates all the possible solutions to restore the graph connectivity, and outputs the one with the smallest residual error. We have extensively tested our system with a wide range of classic mechanism photos, and experimental results show that the proposed system is able to build high?quality 3D mechanism models without user guidance.
@article{wrro138539,
volume = {37},
number = {7},
month = {October},
author = {M Lin and T Shao and Y Zheng and Z Ren and Y Weng and Y Yang},
note = {{\copyright} 2018 The Author(s) Computer Graphics Forum {\copyright} 2018 The Eurographics Association and John Wiley \& Sons Ltd. Published by John Wiley \& Sons Ltd. This is the peer reviewed version of the following article: Automatic Mechanism Modeling from a Single Image with CNNs, which has been published in final form at https://doi.org/10.1111/cgf.13572. This article may be used for non-commercial purposes in accordance with Wiley Terms and Conditions for Use of Self-Archived Versions.},
title = {Automatic Mechanism Modeling from a Single Image with CNNs},
publisher = {Wiley},
year = {2018},
journal = {Computer Graphics Forum},
pages = {337--348},
keywords = {CCS Concepts; ?Computing methodologies {$\rightarrow$} Image processing; Shape modeling; Neural networks},
url = {https://eprints.whiterose.ac.uk/138539/},
abstract = {This paper presents a novel system that enables a fully automatic modeling of both 3D geometry and functionality of a mechanism assembly from a single RGB image. The resulting 3D mechanism model highly resembles the one in the input image with the geometry, mechanical attributes, connectivity, and functionality of all the mechanical parts prescribed in a physically valid way. This challenging task is realized by combining various deep convolutional neural networks to provide high?quality and automatic part detection, segmentation, camera pose estimation and mechanical attributes retrieval for each individual part component. On the top of this, we use a local/global optimization algorithm to establish geometric interdependencies among all the parts while retaining their desired spatial arrangement. We use an interaction graph to abstract the inter?part connection in the resulting mechanism system. If an isolated component is identified in the graph, our system enumerates all the possible solutions to restore the graph connectivity, and outputs the one with the smallest residual error. We have extensively tested our system with a wide range of classic mechanism photos, and experimental results show that the proposed system is able to build high?quality 3D mechanism models without user guidance.}
}We present a taxonomy-driven approach to requirements specification in a large-scale project setting, drawing on our work to develop visualization dashboards for improving the quality of healthcare. Our aim is to overcome some of the limitations of the qualitative methods that are typically used for requirements analysis. When applied alone, methods like interviews fall short in identifying the full set of functionalities that a visualization system should support. We present a five-stage pipeline to structure user task elicitation and analysis around well-established taxonomic dimensions, and make the following contributions: (i) criteria for selecting dimensions from the large body of task taxonomies in the literature,, (ii) use of three particular dimensions (granularity, type cardinality and target) to create materials for a requirements analysis workshop with domain experts, (iii) a method for characterizing the task space that was produced by the experts in the workshop, (iv) a decision tree that partitions that space and maps it to visualization design alternatives, and (v) validating our approach by testing the decision tree against new tasks that collected through interviews with further domain experts.
@misc{wrro136486,
booktitle = {BELIV Workshop 2018},
month = {October},
title = {From Taxonomy to Requirements: A Task Space Partitioning Approach},
author = {M Elshehal and N Alvarado and L McVey and R Randell and M Mamas and RA Ruddle},
publisher = {IEEE},
year = {2018},
journal = {Proceedings of the IEEE VIS Workshop on Evaluation and Beyond ? Methodological Approaches for Visualization (BELIV)},
keywords = {Human-centered computing, Visualization, Visualization design and evaluation methods},
url = {https://eprints.whiterose.ac.uk/136486/},
abstract = {We present a taxonomy-driven approach to requirements specification in a large-scale project setting, drawing on our work to develop visualization dashboards for improving the quality of healthcare. Our aim is to overcome some of the limitations of the qualitative methods that are typically used for requirements analysis. When applied alone, methods like interviews fall short in identifying the full set of functionalities that a visualization system should support. We present a five-stage pipeline to structure user task elicitation and analysis around well-established taxonomic dimensions, and make the following contributions: (i) criteria for selecting dimensions from the large body of task taxonomies in the literature,, (ii) use of three particular dimensions (granularity, type cardinality and target) to create materials for a requirements analysis workshop with domain experts, (iii) a method for characterizing the task space that was produced by the experts in the workshop, (iv) a decision tree that partitions that space and maps it to visualization design alternatives, and (v) validating our approach by testing the decision tree against new tasks that collected through interviews with further domain experts.}
}Controlling a crowd using multi?touch devices appeals to the computer games and animation industries, as such devices provide a high?dimensional control signal that can effectively define the crowd formation and movement. However, existing works relying on pre?defined control schemes require the users to learn a scheme that may not be intuitive. We propose a data?driven gesture?based crowd control system, in which the control scheme is learned from example gestures provided by different users. In particular, we build a database with pairwise samples of gestures and crowd motions. To effectively generalize the gesture style of different users, such as the use of different numbers of fingers, we propose a set of gesture features for representing a set of hand gesture trajectories. Similarly, to represent crowd motion trajectories of different numbers of characters over time, we propose a set of crowd motion features that are extracted from a Gaussian mixture model. Given a run?time gesture, our system extracts the K nearest gestures from the database and interpolates the corresponding crowd motions in order to generate the run?time control. Our system is accurate and efficient, making it suitable for real?time applications such as real?time strategy games and interactive animation controls.
@article{wrro128152,
volume = {37},
number = {6},
month = {July},
author = {Y Shen and J Henry and H Wang and ESL Ho and T Komura and HPH Shum},
note = {{\copyright} 2018 The Authors Computer Graphics Forum published by John Wiley \& Sons Ltd. This is an open access article under the terms of the Creative Commons Attribution License, https://creativecommons.org/licenses/by/4.0/ which permits use, distribution and reproduction in any medium,
provided the original work is properly cited.},
title = {Data Driven Crowd Motion Control with Multi-touch Gestures},
publisher = {Wiley},
year = {2018},
journal = {Computer Graphics Forum},
pages = {382--394},
keywords = {Animation; I.3.7 [Computer Graphics]: Three-Dimensional Graphics and Realism-Animation},
url = {https://eprints.whiterose.ac.uk/128152/},
abstract = {Controlling a crowd using multi?touch devices appeals to the computer games and animation industries, as such devices provide a high?dimensional control signal that can effectively define the crowd formation and movement. However, existing works relying on pre?defined control schemes require the users to learn a scheme that may not be intuitive. We propose a data?driven gesture?based crowd control system, in which the control scheme is learned from example gestures provided by different users. In particular, we build a database with pairwise samples of gestures and crowd motions. To effectively generalize the gesture style of different users, such as the use of different numbers of fingers, we propose a set of gesture features for representing a set of hand gesture trajectories. Similarly, to represent crowd motion trajectories of different numbers of characters over time, we propose a set of crowd motion features that are extracted from a Gaussian mixture model. Given a run?time gesture, our system extracts the K nearest gestures from the database and interpolates the corresponding crowd motions in order to generate the run?time control. Our system is accurate and efficient, making it suitable for real?time applications such as real?time strategy games and interactive animation controls.}
}This paper explores how a set-based visual analytics approach could be useful for analyzing customers' shopping behavior, and makes three main contributions. First, it describes the scale and characteristics of a real-world retail dataset from a major supermarket. Second, it presents a scalable visual analytics workflow to quickly identify patterns in shopping behavior. To assess the workflow, we conducted a case study that used data from four convenience stores and provides several insights about customers' shopping behavior. Third, from our experience with analyzing real-world retail data and comments made by our industry partner, we outline four research challenges for visual analytics to tackle large set intersection problems.
@misc{wrro131939,
volume = {EuroVA},
month = {June},
author = {M Adnan and R Ruddle},
note = {(c) 2018, The Author(s). Eurographics Proceedings (c) 2018, The Eurographics Association. Uploaded in accordance with the publisher's self-archiving policy. },
booktitle = {9th International EuroVis Workshop on Visual Analytics},
title = {A set-based visual analytics approach to analyze retail data},
publisher = {The Eurographics Association},
year = {2018},
journal = {Proceedings of the EuroVis Workshop on Visual Analytics (EuroVA18)},
url = {https://eprints.whiterose.ac.uk/131939/},
abstract = {This paper explores how a set-based visual analytics approach could be useful for analyzing customers' shopping behavior, and makes three main contributions. First, it describes the scale and characteristics of a real-world retail dataset from a major supermarket. Second, it presents a scalable visual analytics workflow to quickly identify patterns in shopping behavior. To assess the workflow, we conducted a case study that used data from four convenience stores and provides several insights about customers' shopping behavior. Third, from our experience with analyzing real-world retail data and comments made by our industry partner, we outline four research challenges for visual analytics to tackle large set intersection problems.}
}The aim of the PETMiner software is to reduce the time and monetary cost of analysing petrophysical data that is obtained from reservoir sample cores. Analysis of these data requires tacit knowledge to fill ?gaps? so that predictions can be made for incomplete data. Through discussions with 30 industry and academic specialists, we identified three analysis use cases that exemplified the limitations of current petrophysics analysis tools. We used those use cases to develop nine core requirements for PETMiner, which is innovative because of its ability to display detailed images of the samples as data points, directly plot multiple sample properties and derived measures for comparison, and substantially reduce interaction cost. An 11-month evaluation demonstrated benefits across all three use cases by allowing a consultant to: (1) generate more accurate reservoir flow models, (2) discover a previously unknown relationship between one easy-to-measure property and another that is costly, and (3) make a 100-fold reduction in the time required to produce plots for a report.
@article{wrro113580,
volume = {24},
number = {5},
month = {May},
author = {DG Harrison and ND Efford and QJ Fisher and RA Ruddle},
note = {{\copyright} 2017 IEEE. Personal use of this material is permitted. Permission from IEEE must be obtained for all other users, including reprinting/ republishing this material for advertising or promotional purposes, creating new collective works for resale or redistribution to servers or lists, or reuse of any copyrighted components of this work in other works.},
title = {PETMiner - A visual analysis tool for petrophysical properties of core sample data},
publisher = {Institute of Electrical and Electronics Engineers (IEEE)},
year = {2018},
journal = {IEEE Transactions on Visualization and Computer Graphics},
pages = {1728--1741},
keywords = {Visualization Systems and Software; Information Visualization; Design Study},
url = {https://eprints.whiterose.ac.uk/113580/},
abstract = {The aim of the PETMiner software is to reduce the time and monetary cost of analysing petrophysical data that is obtained from reservoir sample cores. Analysis of these data requires tacit knowledge to fill ?gaps? so that predictions can be made for incomplete data. Through discussions with 30 industry and academic specialists, we identified three analysis use cases that exemplified the limitations of current petrophysics analysis tools. We used those use cases to develop nine core requirements for PETMiner, which is innovative because of its ability to display detailed images of the samples as data points, directly plot multiple sample properties and derived measures for comparison, and substantially reduce interaction cost. An 11-month evaluation demonstrated benefits across all three use cases by allowing a consultant to: (1) generate more accurate reservoir flow models, (2) discover a previously unknown relationship between one easy-to-measure property and another that is costly, and (3) make a 100-fold reduction in the time required to produce plots for a report.}
}This paper presents a method to reconstruct a functional mechanical assembly from raw scans. Given multiple input scans of a mechanical assembly, our method first extracts the functional mechanical parts using a motion-guided, patch-based hierarchical registration and labeling algorithm. The extracted functional parts are then parameterized from the segments and their internal mechanical relations are encoded by a graph. We use a joint optimization to solve for the best geometry, placement, and orientation of each part, to obtain a final workable mechanical assembly. We demonstrated our algorithm on various types of mechanical assemblies with diverse settings and validated our output using physical fabrication.
@article{wrro134214,
volume = {24},
number = {3},
month = {March},
author = {M Lin and T Shao and Y Zheng and NJ Mitra and K Zhou},
note = {{\copyright} 2017 IEEE. Personal use of this material is permitted. Permission from IEEE must be obtained for all other uses, in any current or future media, including reprinting/republishing this material for advertising or promotional purposes, creating new collective works, for resale or redistribution to servers or lists, or reuse of any copyrighted component of this work in other works.},
title = {Recovering Functional Mechanical Assemblies from Raw Scans},
publisher = {IEEE},
year = {2018},
journal = {IEEE Transactions on Visualization and Computer Graphics},
pages = {1354--1367},
keywords = {3D scanning; mechanical assembly; functionality; mechanical constraints; motion},
url = {https://eprints.whiterose.ac.uk/134214/},
abstract = {This paper presents a method to reconstruct a functional mechanical assembly from raw scans. Given multiple input scans of a mechanical assembly, our method first extracts the functional mechanical parts using a motion-guided, patch-based hierarchical registration and labeling algorithm. The extracted functional parts are then parameterized from the segments and their internal mechanical relations are encoded by a graph. We use a joint optimization to solve for the best geometry, placement, and orientation of each part, to obtain a final workable mechanical assembly. We demonstrated our algorithm on various types of mechanical assemblies with diverse settings and validated our output using physical fabrication.}
}Rendering vector maps is a key challenge for high?quality geographic visualization systems. In this paper, we present a novel approach to visualize vector maps over detailed terrain models in a pixel?precise way. Our method proposes a deferred line rendering technique to display vector maps directly in a screen?space shading stage over the 3D terrain visualization. Due to the absence of traditional geometric polygonal rendering, our algorithm is able to outperform conventional vector map rendering algorithms for geographic information systems, and supports advanced line anti?aliasing as well as slope distortion correction. Furthermore, our deferred line rendering enables interactively customizable advanced vector styling methods as well as a tool for interactive pixel?based editing operations.
@article{wrro169264,
volume = {37},
number = {1},
month = {February},
author = {M Th{\"o}ny and M Billeter and R Pajarola},
note = {{\copyright} 2017 The Authors Computer Graphics Forum {\copyright} 2017 The Eurographics Association and John Wiley \& Sons Ltd.
This is the peer reviewed version of the following article: Th{\"o}ny, M., Billeter, M. and Pajarola, R. (2018), Large?Scale Pixel?Precise Deferred Vector Maps. Computer Graphics Forum, 37: 338-349. , which has been published in final form at https://doi.org/10.1111/cgf.13294. This article may be used for non-commercial purposes in accordance with Wiley Terms and Conditions for Use of Self-Archived Versions},
title = {Large-Scale Pixel-Precise Deferred Vector Maps},
publisher = {Wiley},
doi = {10.1111/cgf.13294},
year = {2018},
journal = {Computer Graphics Forum},
pages = {338--349},
keywords = {real?time rendering; rendering; scientific visualization; visualization; I.3.3 [Computer Graphics]: Picture/Image Generation?Line and curve generation},
url = {https://eprints.whiterose.ac.uk/169264/},
abstract = {Rendering vector maps is a key challenge for high?quality geographic visualization systems. In this paper, we present a novel approach to visualize vector maps over detailed terrain models in a pixel?precise way. Our method proposes a deferred line rendering technique to display vector maps directly in a screen?space shading stage over the 3D terrain visualization. Due to the absence of traditional geometric polygonal rendering, our algorithm is able to outperform conventional vector map rendering algorithms for geographic information systems, and supports advanced line anti?aliasing as well as slope distortion correction. Furthermore, our deferred line rendering enables interactively customizable advanced vector styling methods as well as a tool for interactive pixel?based editing operations.}
}Automatic evaluation of sports skills has been an active research area. However, most of the existing research focuses on low-level features such as movement speed and strength. In this work, we propose a framework for automatic motion analysis and visualization, which allows us to evaluate high-level skills such as the richness of actions, the flexibility of transitions and the unpredictability of action patterns. The core of our framework is the construction and visualization of the posture-based graph that focuses on the standard postures for launching and ending actions, as well as the action-based graph that focuses on the preference of actions and their transition probability. We further propose two numerical indices, the Connectivity Index and the Action Strategy Index, to assess skill level according to the graph. We demonstrate our framework with motions captured from different boxers. Experimental results demonstrate that our system can effectively visualize the strengths and weaknesses of the boxers.
@article{wrro122401,
volume = {69},
month = {December},
author = {Y Shen and H Wang and ESL Ho and L Yang and HPH Shum},
note = {{\copyright} 2017 The Author(s). Published by Elsevier Ltd. This is an open access article under the terms of the Creative Commons Attribution License (CC-BY). },
title = {Posture-based and Action-based Graphs for Boxing Skill Visualization},
publisher = {Elsevier},
year = {2017},
journal = {Computers and Graphics},
pages = {104--115},
keywords = {Motion Graph; Hidden Markov Model; Information Visualization; Dimensionality Reduction; Human Motion Analysis; Boxing},
url = {https://eprints.whiterose.ac.uk/122401/},
abstract = {Automatic evaluation of sports skills has been an active research area. However, most of the existing research focuses on low-level features such as movement speed and strength. In this work, we propose a framework for automatic motion analysis and visualization, which allows us to evaluate high-level skills such as the richness of actions, the flexibility of transitions and the unpredictability of action patterns. The core of our framework is the construction and visualization of the posture-based graph that focuses on the standard postures for launching and ending actions, as well as the action-based graph that focuses on the preference of actions and their transition probability. We further propose two numerical indices, the Connectivity Index and the Action Strategy Index, to assess skill level according to the graph. We demonstrate our framework with motions captured from different boxers. Experimental results demonstrate that our system can effectively visualize the strengths and weaknesses of the boxers.}
}@inproceedings{wrro121250,
booktitle = {ACM SIGGRAPH ASIA Workshop: Data-Driven Animation Techniques (D2AT)},
month = {November},
title = {Synthesizing Motion with Relative Emotion Strength},
author = {ESL Ho and HPH Shum and H Wang and L Yi},
year = {2017},
note = {{\copyright} 2017 Copyright held by the owner?author(s). This is the author's version of the work. It is posted here by permission of ACM for your personal use. Not for redistribution. The definitive version will be published in D2AT proceedings. Uploaded in accordance with the publisher's self-archiving policy. },
url = {https://eprints.whiterose.ac.uk/121250/}
}The rising quantity and complexity of data creates a need to design and optimize data processing pipelines ? the set of data processing steps, parameters and algorithms that perform operations on the data. Visualization can support this process but, although there are many examples of systems for visual parameter analysis, there remains a need to systematically assess users? requirements and match those requirements to exemplar visualization methods. This article presents a new characterization of the requirements for pipeline design and optimization. This characterization is based on both a review of the literature and first-hand assessment of eight application case studies. We also match these requirements with exemplar functionality provided by existing visualization tools. Thus, we provide end-users and visualization developers with a way of identifying functionality that addresses data processing problems in an application. We also identify seven future challenges for visualization research that are not met by the capabilities of today?s systems.
@article{wrro104078,
volume = {23},
number = {8},
month = {August},
author = {T von Landesberger and DW Fellner and RA Ruddle},
note = {(c) 2016, IEEE. Personal use of this material is permitted. Permission from IEEE must be obtained for all other users, including reprinting/ republishing this material for advertising or promotional purposes, creating new collective works for resale or redistribution to servers or lists, or reuse of any copyrighted components of this work in other works.},
title = {Visualization system requirements for data processing pipeline design and optimization},
publisher = {Institute of Electrical and Electronics Engineers (IEEE)},
year = {2017},
journal = {IEEE Transactions on Visualization and Computer Graphics},
pages = {2028--2041},
keywords = {Visualization systems, requirement analysis, data processing pipelines},
url = {https://eprints.whiterose.ac.uk/104078/},
abstract = {The rising quantity and complexity of data creates a need to design and optimize data processing pipelines ? the set of data processing steps, parameters and algorithms that perform operations on the data. Visualization can support this process but, although there are many examples of systems for visual parameter analysis, there remains a need to systematically assess users? requirements and match those requirements to exemplar visualization methods. This article presents a new characterization of the requirements for pipeline design and optimization. This characterization is based on both a review of the literature and first-hand assessment of eight application case studies. We also match these requirements with exemplar functionality provided by existing visualization tools. Thus, we provide end-users and visualization developers with a way of identifying functionality that addresses data processing problems in an application. We also identify seven future challenges for visualization research that are not met by the capabilities of today?s systems.}
}We present a novel approach for constructing a complete 3D model for an object from a single RGBD image. Given an image of an object segmented from the background, a collection of 3D models of the same category are non-rigidly aligned with the input depth, to compute a rough initial result. A volumetric-patch-based optimization algorithm is then performed to refine the initial result to generate a 3D model that not only is globally consistent with the overall shape expected from the input image but also possesses geometric details similar to those in the input image. The optimization with a set of high-level constraints, such as visibility, surface confidence and symmetry, can achieve more robust and accurate completion over state-of-the art techniques. We demonstrate the efficiency and robustness of our approach with multiple categories of objects with various geometries and details, including busts, chairs, bikes, toys, vases and tables.
@article{wrro134259,
volume = {23},
number = {7},
month = {July},
author = {D Li and T Shao and H Wu and K Zhou},
note = {(c) 2016 IEEE. Personal use of this material is permitted. Permission from IEEE must be obtained for all other uses, in any current or future media, including reprinting/republishing this material for advertising or promotional purposes, creating new collective works, for resale or redistribution to servers or lists, or reuse of any copyrighted component of this work in other works.},
title = {Shape Completion from a Single RGBD Image},
publisher = {IEEE},
year = {2017},
journal = {IEEE Transactions on Visualization and Computer Graphics},
pages = {1809--1822},
keywords = {RGBD camera; shape completion; single RGBD image},
url = {https://eprints.whiterose.ac.uk/134259/},
abstract = {We present a novel approach for constructing a complete 3D model for an object from a single RGBD image. Given an image of an object segmented from the background, a collection of 3D models of the same category are non-rigidly aligned with the input depth, to compute a rough initial result. A volumetric-patch-based optimization algorithm is then performed to refine the initial result to generate a 3D model that not only is globally consistent with the overall shape expected from the input image but also possesses geometric details similar to those in the input image. The optimization with a set of high-level constraints, such as visibility, surface confidence and symmetry, can achieve more robust and accurate completion over state-of-the art techniques. We demonstrate the efficiency and robustness of our approach with multiple categories of objects with various geometries and details, including busts, chairs, bikes, toys, vases and tables.}
}Isosurfaces are fundamental geometrical objects for the analysis and visualization of volumetric scalar fields. Recent work has generalized them to bivariate volumetric fields with fiber surfaces, the pre-image of polygons in range space. However, the existing algorithm for their computation is approximate, and is limited to closed polygons. Moreover, its runtime performance does not allow instantaneous updates of the fiber surfaces upon user edits of the polygons. Overall, these limitations prevent a reliable and interactive exploration of the space of fiber surfaces. This paper introduces the first algorithm for the exact computation of fiber surfaces in tetrahedral meshes. It assumes no restriction on the topology of the input polygon, handles degenerate cases and better captures sharp features induced by polygon bends. The algorithm also allows visualization of individual fibers on the output surface, better illustrating their relationship with data features in range space. To enable truly interactive exploration sessions, we further improve the runtime performance of this algorithm. In particular, we show that it is trivially parallelizable and that it scales nearly linearly with the number of cores. Further, we study acceleration data-structures both in geometrical domain and range space and we show how to generalize interval trees used in isosurface extraction to fiber surface extraction. Experiments demonstrate the superiority of our algorithm over previous work, both in terms of accuracy and running time, with up to two orders of magnitude speedups. This improvement enables interactive edits of range polygons with instantaneous updates of the fiber surface for exploration purpose. A VTK-based reference implementation is provided as additional material to reproduce our results.
@article{wrro100067,
volume = {23},
number = {7},
month = {July},
author = {P Klacansky and J Tierny and H Carr and Z Geng},
note = {(c) 2016 IEEE. Personal use of this material is permitted. Permission from IEEE must be obtained for all other users, including reprinting/ republishing this material for advertising or promotional purposes, creating new collective works for resale or redistribution to servers or lists, or reuse of any copyrighted components of this work in other works.},
title = {Fast and Exact Fiber Surfaces for Tetrahedral Meshes},
publisher = {Institute of Electrical and Electronics Engineers (IEEE)},
year = {2017},
journal = {IEEE Transactions on Visualization and Computer Graphics},
pages = {1782--1795},
keywords = {Bivariate Data, Data Segmentation, Data Analysis, Isosurfaces, Continuous Scatterplot},
url = {https://eprints.whiterose.ac.uk/100067/},
abstract = {Isosurfaces are fundamental geometrical objects for the analysis and visualization of volumetric scalar fields. Recent work has generalized them to bivariate volumetric fields with fiber surfaces, the pre-image of polygons in range space. However, the existing algorithm for their computation is approximate, and is limited to closed polygons. Moreover, its runtime performance does not allow instantaneous updates of the fiber surfaces upon user edits of the polygons. Overall, these limitations prevent a reliable and interactive exploration of the space of fiber surfaces. This paper introduces the first algorithm for the exact computation of fiber surfaces in tetrahedral meshes. It assumes no restriction on the topology of the input polygon, handles degenerate cases and better captures sharp features induced by polygon bends. The algorithm also allows visualization of individual fibers on the output surface, better illustrating their relationship with data features in range space. To enable truly interactive exploration sessions, we further improve the runtime performance of this algorithm. In particular, we show that it is trivially parallelizable and that it scales nearly linearly with the number of cores. Further, we study acceleration data-structures both in geometrical domain and range space and we show how to generalize interval trees used in isosurface extraction to fiber surface extraction. Experiments demonstrate the superiority of our algorithm over previous work, both in terms of accuracy and running time, with up to two orders of magnitude speedups. This improvement enables interactive edits of range polygons with instantaneous updates of the fiber surface for exploration purpose. A VTK-based reference implementation is provided as additional material to reproduce our results.}
}This research addresses the general topic of ?keeping found things found? by investigating difficulties people encounter when revisiting webpages, and designing and evaluating a novel tool that addresses those difficulties. The research focused on occasional revisits{–}webpages that people have previously visited on only one day, a week or more ago (i.e. neither frequently nor recently). A 3-month logging study was combined with a laboratory experiment to identify 10 underlying causes of participants? revisiting failure. Overall, 61\% of the failures occurred when a webpage had originally been accessed via search results, was on a topic a participant often looked at or was on a known but large website. Then, we designed a novel visual Web history tool to address the causes of failure and implemented it as a Firefox add-on. The tool was evaluated in a 3-month field study, helped participants succeed on 96\% of revisits, and was also used by some participants to review and reminisce about their ?travels? online. Revised versions of the tool have been publicly released as the Firefox add-on MyWebSteps.
@article{wrro110716,
volume = {29},
number = {4},
month = {July},
author = {TV Do and RA Ruddle},
note = {{\copyright} The Author 2017. Published by Oxford University Press on behalf of The British Computer Society. This is a pre-copyedited, author-produced PDF of an article accepted for publication in Interacting with Computers following peer review. The version of record Trien V. Do, Roy A. Ruddle; MyWebSteps: Aiding Revisiting with a Visual Web History. Interact Comput 2017 1-22. doi: 10.1093/iwc/iww038 is available online at: https://doi.org/10.1093/iwc/iww038.},
title = {MyWebSteps: Aiding Revisiting with a Visual Web History},
publisher = {Oxford University Press},
year = {2017},
journal = {Interacting with Computers},
pages = {530--551},
keywords = {laboratory experiments, field studies, user centered design, scenario-based design, visualization systems and tools, personalization (WWW)},
url = {https://eprints.whiterose.ac.uk/110716/},
abstract = {This research addresses the general topic of ?keeping found things found? by investigating difficulties people encounter when revisiting webpages, and designing and evaluating a novel tool that addresses those difficulties. The research focused on occasional revisits{--}webpages that people have previously visited on only one day, a week or more ago (i.e. neither frequently nor recently). A 3-month logging study was combined with a laboratory experiment to identify 10 underlying causes of participants? revisiting failure. Overall, 61\% of the failures occurred when a webpage had originally been accessed via search results, was on a topic a participant often looked at or was on a known but large website. Then, we designed a novel visual Web history tool to address the causes of failure and implemented it as a Firefox add-on. The tool was evaluated in a 3-month field study, helped participants succeed on 96\% of revisits, and was also used by some participants to review and reminisce about their ?travels? online. Revised versions of the tool have been publicly released as the Firefox add-on MyWebSteps.}
}Representative distribution of body shapes is needed when simulating crowds in real-world situations, e.g., for city or event planning. Visual realism and plausibility are often also required for visualization purposes, while these are the top criteria for crowds in entertainment applications such as games and movie production. Therefore, achieving representative and visually plausible body-shape variation while optimizing available resources is an important goal. We present a data-driven approach to generating and selecting models with varied body shapes, based on body measurement and demographic data from the CAESAR anthropometric database. We conducted an online perceptual study to explore the relationship between body shape, distinctiveness and attractiveness for bodies close to the median height and girth. We found that the most salient body differences are in size and upper-lower body ratios, in particular with respect to shoulders, waist and hips. Based on these results, we propose strategies for body shape selection and distribution that we have validated with a lab-based perceptual study. Finally, we demonstrate our results in a data-driven crowd system with perceptually plausible and varied body shape distribution.
@misc{wrro113877,
month = {June},
author = {Y Shi and J Ondrej and H Wang and C O?Sullivan},
note = {{\copyright} 2017, IEEE. Personal use of this material is permitted. Permission from IEEE must be obtained for all other uses, in any current or future media, including reprinting/republishing this material for advertising or promotional purposes, creating new collective works, for resale or redistribution to servers or lists, or reuse of any copyrighted component of this work in other works.},
booktitle = {VHCIE workshop, IEEE Virtual Reality 2017},
title = {Shape up! Perception based body shape variation for data-driven crowds},
publisher = {IEEE},
journal = {2017 IEEE Virtual Humans and Crowds for Immersive Environments (VHCIE)},
year = {2017},
url = {https://eprints.whiterose.ac.uk/113877/},
abstract = {Representative distribution of body shapes is needed when simulating crowds in real-world situations, e.g., for city or event planning. Visual realism and plausibility are often also required for visualization purposes, while these are the top criteria for crowds in entertainment applications such as games and movie production. Therefore, achieving representative and visually plausible body-shape variation while optimizing available resources is an important goal. We present a data-driven approach to generating and selecting models with varied body shapes, based on body measurement and demographic data from the CAESAR anthropometric database. We conducted an online perceptual study to explore the relationship between body shape, distinctiveness and attractiveness for bodies close to the median height and girth. We found that the most salient body differences are in size and upper-lower body ratios, in particular with respect to shoulders, waist and hips. Based on these results, we propose strategies for body shape selection and distribution that we have validated with a lab-based perceptual study. Finally, we demonstrate our results in a data-driven crowd system with perceptually plausible and varied body shape distribution.}
}We propose the first system for live dynamic augmentation of human faces. Using projector?based illumination, we alter the appearance of human performers during novel performances. The key challenge of live augmentation is latency {–} an image is generated according to a specific pose, but is displayed on a different facial configuration by the time it is projected. Therefore, our system aims at reducing latency during every step of the process, from capture, through processing, to projection. Using infrared illumination, an optically and computationally aligned high?speed camera detects facial orientation as well as expression. The estimated expression blendshapes are mapped onto a lower dimensional space, and the facial motion and non?rigid deformation are estimated, smoothed and predicted through adaptive Kalman filtering. Finally, the desired appearance is generated interpolating precomputed offset textures according to time, global position, and expression. We have evaluated our system through an optimized CPU and GPU prototype, and demonstrated successful low latency augmentation for different performers and performances with varying facial play and motion speed. In contrast to existing methods, the presented system is the first method which fully supports dynamic facial projection mapping without the requirement of any physical tracking markers and incorporates facial expressions.
@article{wrro169265,
volume = {36},
number = {2},
month = {May},
author = {AH Bermano and M Billeter and D Iwai and A Grundh{\"o}fer},
note = {{\copyright} 2017 The Author(s) Computer Graphics Forum {\copyright} 2017 The Eurographics Association and John Wiley \& Sons Ltd. Published by John Wiley \& Sons Ltd.
This is the peer reviewed version of the following article: Bermano, A.H., Billeter, M., Iwai, D. and Grundh{\"o}fer, A. (2017), Makeup Lamps: Live Augmentation of Human Faces via Projection. Computer Graphics Forum, 36: 311-323. , which has been published in final form at https://doi.org/10.1111/cgf.13128. This article may be used for non-commercial purposes in accordance with Wiley Terms and Conditions for Use of Self-Archived Versions.},
title = {Makeup Lamps: Live Augmentation of Human Faces via Projection},
publisher = {Wiley},
doi = {10.1111/cgf.13128},
year = {2017},
journal = {Computer Graphics Forum},
pages = {311--323},
keywords = {Categories and Subject Descriptors (according to ACM CCS); H.5.1 [HCI]: Multimedia Information Systems{--}Artificial, augmented, and virtual realities; I.3.7 [Computer Graphics]: Three?Dimensional Graphics and Realism{--}Animation},
url = {https://eprints.whiterose.ac.uk/169265/},
abstract = {We propose the first system for live dynamic augmentation of human faces. Using projector?based illumination, we alter the appearance of human performers during novel performances. The key challenge of live augmentation is latency {--} an image is generated according to a specific pose, but is displayed on a different facial configuration by the time it is projected. Therefore, our system aims at reducing latency during every step of the process, from capture, through processing, to projection. Using infrared illumination, an optically and computationally aligned high?speed camera detects facial orientation as well as expression. The estimated expression blendshapes are mapped onto a lower dimensional space, and the facial motion and non?rigid deformation are estimated, smoothed and predicted through adaptive Kalman filtering. Finally, the desired appearance is generated interpolating precomputed offset textures according to time, global position, and expression. We have evaluated our system through an optimized CPU and GPU prototype, and demonstrated successful low latency augmentation for different performers and performances with varying facial play and motion speed. In contrast to existing methods, the presented system is the first method which fully supports dynamic facial projection mapping without the requirement of any physical tracking markers and incorporates facial expressions.}
}We propose a new semantic-level crowd evaluation metric in this paper. Crowd simulation has been an active and important area for several decades. However, only recently has there been an increased focus on evaluating the fidelity of the results with respect to real-world situations. The focus to date has been on analyzing the properties of low-level features such as pedestrian trajectories, or global features such as crowd densities. We propose the first approach based on finding semantic information represented by latent Path Patterns in both real and simulated data in order to analyze and compare them. Unsupervised clustering by non-parametric Bayesian inference is used to learn the patterns, which themselves provide a rich visualization of the crowd behavior. To this end, we present a new Stochastic Variational Dual Hierarchical Dirichlet Process (SV-DHDP) model. The fidelity of the patterns is computed with respect to a reference, thus allowing the outputs of different algorithms to be compared with each other and/or with real data accordingly. Detailed evaluations and comparisons with existing metrics show that our method is a good alternative for comparing crowd data at a different level and also works with more types of data, holds fewer assumptions and is more robust to noise.
@article{wrro109726,
volume = {23},
number = {5},
month = {May},
author = {H Wang and J Ondrej and C O'Sullivan},
note = {(c) 2016 IEEE. Personal use of this material is permitted. Permission from IEEE must be obtained for all other users, including reprinting/ republishing this material for advertising or promotional purposes, creating new collective works for resale or redistribution to servers or lists, or reuse of any copyrighted components of this work in other works.},
title = {Trending Paths: A New Semantic-level Metric for Comparing Simulated and Real Crowd Data},
publisher = {Institute of Electrical and Electronics Engineers},
year = {2017},
journal = {IEEE Transaction on Visualization and Computer Graphics},
pages = {1454--1464},
keywords = {Crowd Simulation, Crowd Comparison, Data-Driven, Clustering, Hierarchical Dirichlet Process, Stochastic Optimization},
url = {https://eprints.whiterose.ac.uk/109726/},
abstract = {We propose a new semantic-level crowd evaluation metric in this paper. Crowd simulation has been an active and important area for several decades. However, only recently has there been an increased focus on evaluating the fidelity of the results with respect to real-world situations. The focus to date has been on analyzing the properties of low-level features such as pedestrian trajectories, or global features such as crowd densities. We propose the first approach based on finding semantic information represented by latent Path Patterns in both real and simulated data in order to analyze and compare them. Unsupervised clustering by non-parametric Bayesian inference is used to learn the patterns, which themselves provide a rich visualization of the crowd behavior. To this end, we present a new Stochastic Variational Dual Hierarchical Dirichlet Process (SV-DHDP) model. The fidelity of the patterns is computed with respect to a reference, thus allowing the outputs of different algorithms to be compared with each other and/or with real data accordingly. Detailed evaluations and comparisons with existing metrics show that our method is a good alternative for comparing crowd data at a different level and also works with more types of data, holds fewer assumptions and is more robust to noise.}
}As data sets grow to exascale, automated data analysis and visu- alisation are increasingly important, to intermediate human under- standing and to reduce demands on disk storage via in situ anal- ysis. Trends in architecture of high performance computing sys- tems necessitate analysis algorithms to make effective use of com- binations of massively multicore and distributed systems. One of the principal analytic tools is the contour tree, which analyses rela- tionships between contours to identify features of more than local importance. Unfortunately, the predominant algorithms for com- puting the contour tree are explicitly serial, and founded on serial metaphors, which has limited the scalability of this form of analy- sis. While there is some work on distributed contour tree computa- tion, and separately on hybrid GPU-CPU computation, there is no efficient algorithm with strong formal guarantees on performance allied with fast practical performance. We report the first shared SMP algorithm for fully parallel contour tree computation, with for- mal guarantees of O(lgnlgt) parallel steps and O(nlgn) work, and implementations with up to 10{$\times$} parallel speed up in OpenMP and up to 50{$\times$} speed up in NVIDIA Thrust.
@misc{wrro106038,
month = {March},
author = {HA Carr and GH Weber and CM Sewell and JP Ahrens},
note = {{\copyright} 2016 IEEE. Personal use of this material is permitted. Permission from IEEE must be obtained for all other uses, in any current or future media, including reprinting/republishing this material for advertising or promotional purposes, creating new collective works, for resale or redistribution to servers or lists, or reuse of any copyrighted component of this work in other works.},
booktitle = {LDAV 2016},
title = {Parallel Peak Pruning for Scalable SMP Contour Tree Computation},
publisher = {IEEE},
year = {2017},
journal = {6th IEEE Symposium on Large Data Analysis and Visualization},
pages = {75--84},
keywords = {topological analysis, contour tree, merge tree, data parallel algorithms},
url = {https://eprints.whiterose.ac.uk/106038/},
abstract = {As data sets grow to exascale, automated data analysis and visu- alisation are increasingly important, to intermediate human under- standing and to reduce demands on disk storage via in situ anal- ysis. Trends in architecture of high performance computing sys- tems necessitate analysis algorithms to make effective use of com- binations of massively multicore and distributed systems. One of the principal analytic tools is the contour tree, which analyses rela- tionships between contours to identify features of more than local importance. Unfortunately, the predominant algorithms for com- puting the contour tree are explicitly serial, and founded on serial metaphors, which has limited the scalability of this form of analy- sis. While there is some work on distributed contour tree computa- tion, and separately on hybrid GPU-CPU computation, there is no efficient algorithm with strong formal guarantees on performance allied with fast practical performance. We report the first shared SMP algorithm for fully parallel contour tree computation, with for- mal guarantees of O(lgnlgt) parallel steps and O(nlgn) work, and implementations with up to 10{$\times$} parallel speed up in OpenMP and up to 50{$\times$} speed up in NVIDIA Thrust.}
}Achieving a minimal latency within augmented reality (AR) systems is one of the most important factors to achieve a convincing visual impression. It is even more crucial for non-video augmentations such as dynamic projection mappings because in that case the superimposed imagery has to exactly match the dynamic real surface, which obviously cannot be directly influenced or delayed in its movement. In those cases, the inevitable latency is usually compensated for using prediction and extrapolation operations, which require accurate information about the occurring overall latency to exactly predict to the right time frame for the augmentation. Different strategies have been applied to accurately compute this latency. Since some of these AR systems operate within different spectral bands for input and output, it is not possible to apply latency measurement methods encoding time stamps directly into the presented output images as these might not be sensed by used input device.We present a generic latency measurement device which can be used to accurately measure the overall end-to-end latency of camera-based AR systems with an accuracy below one millisecond. It comprises a LED-based time stamp generator displaying the time as a gray code on spatially and spectrally multiple locations. It is controlled by a micro-controller and sensed by an external camera device observing the output display as well as the LED device at the same time.
@misc{wrro179726,
month = {February},
author = {M Billeter and G Rothlin and J Wezel and D Iwai and A Grundhofer},
note = {{\copyright} 2016 IEEE. Personal use of this material is permitted. Permission from IEEE must be obtained for all other uses, in any current or future media, including reprinting/republishing this material for advertising or promotional purposes, creating new collective works, for resale or redistribution to servers or lists, or reuse of any copyrighted component of this work in other works.},
booktitle = {2016 IEEE International Symposium on Mixed and Augmented Reality (ISMAR-Adjunct)},
title = {A LED-Based IR/RGB End-to-End Latency Measurement Device},
publisher = {IEEE},
doi = {10.1109/ismar-adjunct.2016.0072},
journal = {2016 IEEE International Symposium on Mixed and Augmented Reality (ISMAR-Adjunct)},
year = {2017},
keywords = {H.5.2 [HCI]: User Interfaces{--}Benchmarking},
url = {https://eprints.whiterose.ac.uk/179726/},
abstract = {Achieving a minimal latency within augmented reality (AR) systems is one of the most important factors to achieve a convincing visual impression. It is even more crucial for non-video augmentations such as dynamic projection mappings because in that case the superimposed imagery has to exactly match the dynamic real surface, which obviously cannot be directly influenced or delayed in its movement. In those cases, the inevitable latency is usually compensated for using prediction and extrapolation operations, which require accurate information about the occurring overall latency to exactly predict to the right time frame for the augmentation. Different strategies have been applied to accurately compute this latency. Since some of these AR systems operate within different spectral bands for input and output, it is not possible to apply latency measurement methods encoding time stamps directly into the presented output images as these might not be sensed by used input device.We present a generic latency measurement device which can be used to accurately measure the overall end-to-end latency of camera-based AR systems with an accuracy below one millisecond. It comprises a LED-based time stamp generator displaying the time as a gray code on spatially and spectrally multiple locations. It is controlled by a micro-controller and sensed by an external camera device observing the output display as well as the LED device at the same time.}
}Lattice Quantum Chromodynamics (QCD) is an approach used by theo- retical physicists to model the strong nuclear force. This works at the sub-nuclear scale to bind quarks together into hadrons including the proton and neutron. One of the long term goals in lattice QCD is to produce a phase diagram of QCD matter as thermodynamic control parameters temperature and baryon chemical potential are varied. The ability to predict critical points in the phase diagram, known as phase transitions, is one of the on-going challenges faced by domain scientists. In this work we consider how multivariate topological visualisation techniques can be ap- plied to simulation data to help domain scientists predict the location of phase tran- sitions. In the process it is intended that applying these techniques to lattice QCD will strengthen the interpretation of output from multivariate topological algorithms, including the joint contour net. Lattice QCD presents an interesting opportunity for using these techniques as it offers a rich array of interacting scalar fields for anal- ysis; however, it also presents unique challenges due to its reliance on quantum mechanics to interpret the data.
@inproceedings{wrro114658,
booktitle = {Topology-based Methods in Visualization 2017 (TopoInVis 2017)},
month = {February},
title = {Joint Contour Net analysis of lattice QCD data},
author = {DP Thomas and R Borgo and HA Carr and S Hands},
year = {2017},
keywords = {Computational Topology; Joint Contour Net; Reeb Space},
url = {https://eprints.whiterose.ac.uk/114658/},
abstract = {Lattice Quantum Chromodynamics (QCD) is an approach used by theo- retical physicists to model the strong nuclear force. This works at the sub-nuclear scale to bind quarks together into hadrons including the proton and neutron. One of the long term goals in lattice QCD is to produce a phase diagram of QCD matter as thermodynamic control parameters temperature and baryon chemical potential are varied. The ability to predict critical points in the phase diagram, known as phase transitions, is one of the on-going challenges faced by domain scientists. In this work we consider how multivariate topological visualisation techniques can be ap- plied to simulation data to help domain scientists predict the location of phase tran- sitions. In the process it is intended that applying these techniques to lattice QCD will strengthen the interpretation of output from multivariate topological algorithms, including the joint contour net. Lattice QCD presents an interesting opportunity for using these techniques as it offers a rich array of interacting scalar fields for anal- ysis; however, it also presents unique challenges due to its reliance on quantum mechanics to interpret the data.}
}This paper presents an efficient algorithm for the computation of the Reeb space of an input bivariate piecewise linear scalar function f defined on a tetrahedral mesh. By extending and generalizing algorithmic concepts from the univariate case to the bivariate one, we report the first practical, output-sensitive algorithm for the exact computation of such a Reeb space. The algorithm starts by identifying the Jacobi set of f , the bivariate analogs of critical points in the univariate case. Next, the Reeb space is computed by segmenting the input mesh along the new notion of Jacobi Fiber Surfaces, the bivariate analog of critical contours in the univariate case. We additionally present a simplification heuristic that enables the progressive coarsening of the Reeb space. Our algorithm is simple to implement and most of its computations can be trivially parallelized. We report performance numbers demonstrating orders of magnitude speedups over previous approaches, enabling for the first time the tractable computation of bivariate Reeb spaces in practice. Moreover, unlike range-based quantization approaches (such as the Joint Contour Net), our algorithm is parameter-free. We demonstrate the utility of our approach by using the Reeb space as a semi-automatic segmentation tool for bivariate data. In particular, we introduce continuous scatterplot peeling, a technique which enables the reduction of the cluttering in the continuous scatterplot, by interactively selecting the features of the Reeb space to project. We provide a VTK-based C++ implementation of our algorithm that can be used for reproduction purposes or for the development of new Reeb space based visualization techniques.
@article{wrro103600,
volume = {23},
number = {1},
month = {January},
author = {J Tierny and HA Carr},
note = {{\copyright} 2016 IEEE. Personal use of this material is permitted. Permission from IEEE must be obtained for all other users, including reprinting/ republishing this material for advertising or promotional purposes, creating new collective works for resale or redistribution to servers or lists, or reuse of any copyrighted components of this work in other works.},
title = {Jacobi Fiber Surfaces for Bivariate Reeb Space Computation},
publisher = {Institute of Electrical and Electronics Engineers (IEEE)},
year = {2017},
journal = {IEEE Transactions on Visualization and Computer Graphics},
pages = {960--969},
keywords = {Topological data analysis, multivariate data, data segmentation},
url = {https://eprints.whiterose.ac.uk/103600/},
abstract = {This paper presents an efficient algorithm for the computation of the Reeb space of an input bivariate piecewise linear scalar function f defined on a tetrahedral mesh. By extending and generalizing algorithmic concepts from the univariate case to the bivariate one, we report the first practical, output-sensitive algorithm for the exact computation of such a Reeb space. The algorithm starts by identifying the Jacobi set of f , the bivariate analogs of critical points in the univariate case. Next, the Reeb space is computed by segmenting the input mesh along the new notion of Jacobi Fiber Surfaces, the bivariate analog of critical contours in the univariate case. We additionally present a simplification heuristic that enables the progressive coarsening of the Reeb space. Our algorithm is simple to implement and most of its computations can be trivially parallelized. We report performance numbers demonstrating orders of magnitude speedups over previous approaches, enabling for the first time the tractable computation of bivariate Reeb spaces in practice. Moreover, unlike range-based quantization approaches (such as the Joint Contour Net), our algorithm is parameter-free. We demonstrate the utility of our approach by using the Reeb space as a semi-automatic segmentation tool for bivariate data. In particular, we introduce continuous scatterplot peeling, a technique which enables the reduction of the cluttering in the continuous scatterplot, by interactively selecting the features of the Reeb space to project. We provide a VTK-based C++ implementation of our algorithm that can be used for reproduction purposes or for the development of new Reeb space based visualization techniques.}
}Multifield data are common in visualization. However, reducing these data to comprehensible geometry is a challenging problem. Fiber surfaces, an analogy of isosurfaces to bivariate volume data, are a promising new mechanism for understanding multifield volumes. In this work, we explore direct ray casting of fiber surfaces from volume data without any explicit geometry extraction. We sample directly along rays in domain space, and perform geometric tests in range space where fibers are defined, using a signed distance field derived from the control polygons. Our method requires little preprocess, and enables real-time exploration of data, dynamic modification and pixel-exact rendering of fiber surfaces, and support for higher-order interpolation in domain space. We demonstrate this approach on several bivariate datasets, including analysis of multi-field combustion data.
@article{wrro103601,
volume = {23},
number = {1},
month = {January},
author = {K Wu and A Knoll and BJ Isaac and HA Carr and V Pascucci},
note = {{\copyright} 2016 IEEE. Personal use of this material is permitted. Permission from IEEE must be obtained for all other users, including reprinting/ republishing this material for advertising or promotional purposes, creating new collective works for resale or redistribution to servers or lists, or reuse of any copyrighted components of this work in other works.},
title = {Direct Multifield Volume Ray Casting of Fiber Surfaces},
publisher = {Institute of Electrical and Electronics Engineers (IEEE)},
year = {2017},
journal = {IEEE Transactions on Visualization and Computer Graphics},
pages = {941--949},
keywords = {Multidimensional Data, Volume Rendering, Isosurface; Isosurfaces, Rendering (computer graphics), Casting, Power capacitors, Aerospace electronics, Acceleration, Transfer functions},
url = {https://eprints.whiterose.ac.uk/103601/},
abstract = {Multifield data are common in visualization. However, reducing these data to comprehensible geometry is a challenging problem. Fiber surfaces, an analogy of isosurfaces to bivariate volume data, are a promising new mechanism for understanding multifield volumes. In this work, we explore direct ray casting of fiber surfaces from volume data without any explicit geometry extraction. We sample directly along rays in domain space, and perform geometric tests in range space where fibers are defined, using a signed distance field derived from the control polygons. Our method requires little preprocess, and enables real-time exploration of data, dynamic modification and pixel-exact rendering of fiber surfaces, and support for higher-order interpolation in domain space. We demonstrate this approach on several bivariate datasets, including analysis of multi-field combustion data.}
}Electronic Health Records (EHRs) are an important asset for clinical research and decision making, but the utility of EHR data depends on its quality. In health, quality is typically investigated by using statistical methods to profile data. To complement established methods, we developed a web-based visualisation tool called MonAT Web Application (MonAT) for profiling the completeness and correctness of EHR. The tool was evaluated by four researchers using anthropometric data from the Born in Bradford Project (BiB Project), and this highlighted three advantages. The first was to understand how missingness varied across variables, and especially to do this for subsets of records. The second was to investigate whether certain variables for groups of records were sufficiently complete to be used in subsequent analysis. The third was to portray longitudinally the records for a given person, to improve outlier identification.
@misc{wrro110718,
volume = {5},
author = {M Noselli and D Mason and MA Mohammed and RA Ruddle},
booktitle = {10th International Conference on Health Informatics (HEALTHINF 2017)},
editor = {A Fred and EL Van den Broek and H Gamboa and M Vaz},
title = {MonAT: a VisualWeb-based Tool to Profile Health Data Quality},
publisher = {SCITEPRESS},
year = {2017},
journal = {Proceedings of the 10th International Joint Conference on Biomedical Engineering Systems and Technologies (BIOSTEC 2017)},
pages = {26--34},
keywords = {Data Quality, Visualization, Health Data, Longitudinal Data},
url = {https://eprints.whiterose.ac.uk/110718/},
abstract = {Electronic Health Records (EHRs) are an important asset for clinical research and decision making, but the utility of EHR data depends on its quality. In health, quality is typically investigated by using statistical methods to profile data. To complement established methods, we developed a web-based visualisation tool called MonAT Web Application (MonAT) for profiling the completeness and correctness of EHR. The tool was evaluated by four researchers using anthropometric data from the Born in Bradford Project (BiB Project), and this highlighted three advantages. The first was to understand how missingness varied across variables, and especially to do this for subsets of records. The second was to investigate whether certain variables for groups of records were sufficiently complete to be used in subsequent analysis. The third was to portray longitudinally the records for a given person, to improve outlier identification.}
}We present a technique for parsing widely used furniture assembly instructions, and reconstructing the 3D models of furniture components and their dynamic assembly process. Our technique takes as input a multi-step assembly instruction in a vector graphic format and starts to group the vector graphic primitives into semantic elements representing individual furniture parts, mechanical connectors (e.g., screws, bolts and hinges), arrows, visual highlights, and numbers. To reconstruct the dynamic assembly process depicted over multiple steps, our system identifies previously built 3D furniture components when parsing a new step, and uses them to address the challenge of occlusions while generating new 3D components incrementally. With a wide range of examples covering a variety of furniture types, we demonstrate the use of our system to animate the 3D furniture assembly process and, beyond that, the semantic-aware furniture editing as well as the fabrication of personalized furnitures.
@article{wrro134260,
volume = {35},
number = {6},
month = {November},
author = {T Shao and D Li and Y Rong and C Zheng and K Zhou},
note = {{\copyright} ACM, 2016. This is the author's version of the work. It is posted here by permission of ACM for your personal use. Not for redistribution. The definitive version was published in ACM Transactions on Graphics VOL 35, ISS 6, November 2016. : http://dx.doi.org/10.1145/2980179.2982416},
title = {Dynamic Furniture Modeling Through Assembly Instructions},
publisher = {Association for Computing Machinery},
year = {2016},
journal = {ACM Transactions on Graphics},
keywords = {Assembly instructions; furniture modeling; supervised learning; personalized fabrication},
url = {https://eprints.whiterose.ac.uk/134260/},
abstract = {We present a technique for parsing widely used furniture assembly instructions, and reconstructing the 3D models of furniture components and their dynamic assembly process. Our technique takes as input a multi-step assembly instruction in a vector graphic format and starts to group the vector graphic primitives into semantic elements representing individual furniture parts, mechanical connectors (e.g., screws, bolts and hinges), arrows, visual highlights, and numbers. To reconstruct the dynamic assembly process depicted over multiple steps, our system identifies previously built 3D furniture components when parsing a new step, and uses them to address the challenge of occlusions while generating new 3D components incrementally. With a wide range of examples covering a variety of furniture types, we demonstrate the use of our system to animate the 3D furniture assembly process and, beyond that, the semantic-aware furniture editing as well as the fabrication of personalized furnitures.}
}Motion analysis and visualization are crucial in sports science for sports training and performance evaluation. While primitive computational methods have been proposed for simple analysis such as postures and movements, few can evaluate the high-level quality of sports players such as their skill levels and strategies. We propose a visualization tool to help visualizing boxers' motions and assess their skill levels. Our system automatically builds a graph-based representation from motion capture data and reduces the dimension of the graph onto a 3D space so that it can be easily visualized and understood. In particular, our system allows easy understanding of the boxer's boxing behaviours, preferred actions, potential strength and weakness. We demonstrate the effectiveness of our system on different boxers' motions. Our system not only serves as a tool for visualization, it also provides intuitive motion analysis that can be further used beyond sports science.
@misc{wrro106266,
month = {October},
author = {HPH Shum and H Wang and ESL Ho and T Komura},
note = {(c) 2016 Copyright held by the owner/author(s). This work is licensed under a Creative Commons Attribution International 4.0 License (https://creativecommons.org/licenses/by/4.0/)},
booktitle = {The 9th International Conference on Motion in Games (MIG '16)},
title = {SkillVis: A Visualization Tool for Boxing Skill Assessment},
address = {New York, USA},
publisher = {ACM},
year = {2016},
journal = {MIG '16 Proceedings of the 9th International Conference on Motion in Games},
pages = {145--153},
keywords = {Motion Graph, Information Visualization, Dimensionality Reduction},
url = {https://eprints.whiterose.ac.uk/106266/},
abstract = {Motion analysis and visualization are crucial in sports science for sports training and performance evaluation. While primitive computational methods have been proposed for simple analysis such as postures and movements, few can evaluate the high-level quality of sports players such as their skill levels and strategies. We propose a visualization tool to help visualizing boxers' motions and assess their skill levels. Our system automatically builds a graph-based representation from motion capture data and reduces the dimension of the graph onto a 3D space so that it can be easily visualized and understood. In particular, our system allows easy understanding of the boxer's boxing behaviours, preferred actions, potential strength and weakness. We demonstrate the effectiveness of our system on different boxers' motions. Our system not only serves as a tool for visualization, it also provides intuitive motion analysis that can be further used beyond sports science.}
}Topological simplification of scalar and vector fields is well-established as an effective method for analysing and visualising complex data sets. For multivariate (alternatively, multi-field) data, topological analysis requires simultaneous advances both mathematically and computationally. We propose a robust multivariate topology simplification method based on ?lip?-pruning from the Reeb space. Mathematically, we show that the projection of the Jacobi set of multivariate data into the Reeb space produces a Jacobi structure that separates the Reeb space into simple components. We also show that the dual graph of these components gives rise to a Reeb skeleton that has properties similar to the scalar contour tree and Reeb graph, for topologically simple domains. We then introduce a range measure to give a scaling-invariant total ordering of the components or features that can be used for simplification. Computationally, we show how to compute Jacobi structure, Reeb skeleton, range and geometric measures in the Joint Contour Net (an approximation of the Reeb space) and that these can be used for visualisation similar to the contour tree or Reeb graph.
@article{wrro100068,
volume = {58},
month = {October},
author = {A Chattopadhyay and H Carr and D Duke and Z Geng and O Saeki},
note = {{\copyright} 2016 Elsevier B.V. This is an author produced version of a paper published in Computational Geometry. Uploaded in accordance with the publisher's self-archiving policy.},
title = {Multivariate Topology Simplification},
publisher = {Elsevier},
year = {2016},
journal = {Computational Geometry},
pages = {1--24},
keywords = {Simplification; Multivariate topology; Reeb space; Reeb skeleton; Multi-dimensional Reeb graph},
url = {https://eprints.whiterose.ac.uk/100068/},
abstract = {Topological simplification of scalar and vector fields is well-established as an effective method for analysing and visualising complex data sets. For multivariate (alternatively, multi-field) data, topological analysis requires simultaneous advances both mathematically and computationally. We propose a robust multivariate topology simplification method based on ?lip?-pruning from the Reeb space. Mathematically, we show that the projection of the Jacobi set of multivariate data into the Reeb space produces a Jacobi structure that separates the Reeb space into simple components. We also show that the dual graph of these components gives rise to a Reeb skeleton that has properties similar to the scalar contour tree and Reeb graph, for topologically simple domains. We then introduce a range measure to give a scaling-invariant total ordering of the components or features that can be used for simplification. Computationally, we show how to compute Jacobi structure, Reeb skeleton, range and geometric measures in the Joint Contour Net (an approximation of the Reeb space) and that these can be used for visualisation similar to the contour tree or Reeb graph.}
}Automatically recognizing activities in video is a classic problem in vision and helps to understand behaviors, describe scenes and detect anomalies. We propose an unsupervised method for such purposes. Given video data, we discover recurring activity patterns that appear, peak, wane and disappear over time. By using non-parametric Bayesian methods, we learn coupled spatial and temporal patterns with minimum prior knowledge. To model the temporal changes of patterns, previous works compute Markovian progressions or locally continuous motifs whereas we model time in a globally continuous and non-Markovian way. Visually, the patterns depict flows of major activities. Temporally, each pattern has its own unique appearance-disappearance cycles. To compute compact pattern representations, we also propose a hybrid sampling method. By combining these patterns with detailed environment information, we interpret the semantics of activities and report anomalies. Also, our method fits data better and detects anomalies that were difficult to detect previously.
@misc{wrro106097,
volume = {9909},
month = {September},
author = {H Wang and C O'Sullivan},
note = {(c) 2016, Springer International Publishing. This is an author produced version of a paper published in Lecture Notes in Computer Science. Uploaded in accordance with the publisher's self-archiving policy.},
booktitle = {European Conference on Computer Vision (ECCV) 2016},
title = {Globally Continuous and Non-Markovian Crowd Activity Analysis from Videos},
publisher = {Springer},
year = {2016},
journal = {Computer Vision - ECCV 2016: Lecture Notes in Computer Science},
pages = {527--544},
url = {https://eprints.whiterose.ac.uk/106097/},
abstract = {Automatically recognizing activities in video is a classic problem in vision and helps to understand behaviors, describe scenes and detect anomalies. We propose an unsupervised method for such purposes. Given video data, we discover recurring activity patterns that appear, peak, wane and disappear over time. By using non-parametric Bayesian methods, we learn coupled spatial and temporal patterns with minimum prior knowledge. To model the temporal changes of patterns, previous works compute Markovian progressions or locally continuous motifs whereas we model time in a globally continuous and non-Markovian way. Visually, the patterns depict flows of major activities. Temporally, each pattern has its own unique appearance-disappearance cycles. To compute compact pattern representations, we also propose a hybrid sampling method. By combining these patterns with detailed environment information, we interpret the semantics of activities and report anomalies. Also, our method fits data better and detects anomalies that were difficult to detect previously.}
}Seismic data visualisation and analysis is an area of research interest for a lot of commercial and academic disciplines. It enables the geoscientists to understand structures underneath the earth. It is an important step in building subsurface geological models to identify hydrocarbon reservoirs and running geological simulations. Good quality watertight surface meshes are required for constructing these models for accurate identification and extraction of strata/horizons that contain carbon deposits such as fuel and gas. This research demonstrates extracting watertight geometric surfaces from 3D seismic volumes to improve horizon identification and extraction. Isosurfaces and Fiber Surfaces are proposed for extracting horizons from seismic data. Initial tests with isosurfaces have been conducted and further experiments using fiber furfaces are underway as next direction and discussed in sections 4.5 and 4.6.
@misc{wrro106638,
booktitle = {Computer Graphics \& Visual Computing (CGVC) 2016},
month = {September},
title = {Generating Watertight Isosurfaces from 3D Seismic Data},
author = {MS Khan and H Carr and D Angus},
publisher = {Eurographics Association for Computer Graphics},
year = {2016},
journal = {Computer Graphics \& Visual Computing (CGVC) 2016},
keywords = {Computer Graphics, Volume Visualisation, Isosurfaces, Watertight Meshes, Seismic Volumes, Seismic Horizon, Surface Handles},
url = {https://eprints.whiterose.ac.uk/106638/},
abstract = {Seismic data visualisation and analysis is an area of research interest for a lot of commercial and academic disciplines. It enables the geoscientists to understand structures underneath the earth. It is an important step in building subsurface geological models to identify hydrocarbon reservoirs and running geological simulations. Good quality watertight surface meshes are required for constructing these models for accurate identification and extraction of strata/horizons that contain carbon deposits such as fuel and gas. This research demonstrates extracting watertight geometric surfaces from 3D seismic volumes to improve horizon identification and extraction. Isosurfaces and Fiber Surfaces are proposed for extracting horizons from seismic data. Initial tests with isosurfaces have been conducted and further experiments using fiber furfaces are underway as next direction and discussed in sections 4.5 and 4.6.}
}As data sets increase in size beyond the petabyte, it is increasingly important to have automated methods for data analysis and visualisation. While topological analysis tools such as the contour tree and Morse-Smale complex are now well established, there is still a shortage of efficient parallel algorithms for their computation, in particular for massively data-parallel compu- tation on a SIMD model. We report the first data-parallel algorithm for computing the fully augmented contour tree, using a quantised computation model. We then extend this to provide a hybrid data-parallel / distributed algorithm allowing scaling beyond a single GPU or CPU, and provide results for its computation. Our implementation uses the portable data-parallel primitives provided by NVIDIA?s Thrust library, allowing us to compile our same code for both GPUs and multi-core CPUs.
@misc{wrro107190,
month = {September},
author = {H Carr and C Sewell and L-T Lo and J Ahrens},
booktitle = {CGVC 2016},
editor = {C Turkay and TR Wan},
title = {Hybrid Data-Parallel Contour Tree Computation},
publisher = {The Eurographics Association},
journal = {Computer Graphics \& Visual Computing},
year = {2016},
keywords = {topological analysis, contour tree, merge tree, data parallel algorithms},
url = {https://eprints.whiterose.ac.uk/107190/},
abstract = {As data sets increase in size beyond the petabyte, it is increasingly important to have automated methods for data analysis and visualisation. While topological analysis tools such as the contour tree and Morse-Smale complex are now well established, there is still a shortage of efficient parallel algorithms for their computation, in particular for massively data-parallel compu- tation on a SIMD model. We report the first data-parallel algorithm for computing the fully augmented contour tree, using a quantised computation model. We then extend this to provide a hybrid data-parallel / distributed algorithm allowing scaling beyond a single GPU or CPU, and provide results for its computation. Our implementation uses the portable data-parallel primitives provided by NVIDIA?s Thrust library, allowing us to compile our same code for both GPUs and multi-core CPUs.}
}The present paper asks how can visualization help data scientists make sense of event sequences, and makes three main contributions. The first is a research agenda, which we divide into methods for presentation, interaction & computation, and scale-up. Second, we introduce the concept of Event Maps to help with scale-up, and illustrate coarse-, medium- and fine-grained Event Maps with electronic health record (EHR) data for prostate cancer. Third, in an experiment we investigated participants? ability to judge the similarity of event sequences. Contrary to previous research into categorical data, color and shape were better than position for encoding event type. However, even with simple sequences (5 events of 3 types in the target sequence), participants only got 88\% correct despite averaging 7.4 seconds to respond. This indicates that simple visualization techniques are not effective.
@misc{wrro106008,
booktitle = {The Event Event: Temporal \& Sequential Event Analysis - An IEEE VIS 2016 Workshop},
month = {September},
title = {Methods and a research agenda for the evaluation of event sequence visualization techniques},
author = {RA Ruddle and J Bernard and T May and H L{\"u}cke-Tieke and J Kohlhammer},
year = {2016},
note = {This is an author produced version of a conference paper accepted by The Event Event: Temporal \& Sequential Event Analysis - An IEEE VIS 2016 Workshop, available online at http://eventevent.github.io/papers/EVENT\_2016\_paper\_9.pdf.},
journal = {Proceedings of the IEEE VIS 2016 Workshop on Temporal \& Sequential Event Analysis.},
keywords = {Visualization; Electronic Health Records; Event Sequences; Research agenda; Evaluation},
url = {https://eprints.whiterose.ac.uk/106008/},
abstract = {The present paper asks how can visualization help data scientists make sense of event sequences, and makes three main contributions. The first is a research agenda, which we divide into methods for presentation, interaction \& computation, and scale-up. Second, we introduce the concept of Event Maps to help with scale-up, and illustrate coarse-, medium- and fine-grained Event Maps with electronic health record (EHR) data for prostate cancer. Third, in an experiment we investigated participants? ability to judge the similarity of event sequences. Contrary to previous research into categorical data, color and shape were better than position for encoding event type. However, even with simple sequences (5 events of 3 types in the target sequence), participants only got 88\% correct despite averaging 7.4 seconds to respond. This indicates that simple visualization techniques are not effective.}
}We present a novel image-based representation for dynamic 3D avatars, which allows effective handling of various hairstyles and headwear, and can generate expressive facial animations with fine-scale details in real-time. We develop algorithms for creating an image-based avatar from a set of sparsely captured images of a user, using an off-the-shelf web camera at home. An optimization method is proposed to construct a topologically consistent morphable model that approximates the dynamic hair geometry in the captured images. We also design a real-time algorithm for synthesizing novel views of an image-based avatar, so that the avatar follows the facial motions of an arbitrary actor. Compelling results from our pipeline are demonstrated on a variety of cases.
@article{wrro134265,
volume = {35},
number = {4},
month = {July},
author = {C Cao and H Wu and Y Weng and T Shao and K Zhou},
note = {{\copyright} ACM, 2016. This is the author's version of the work. It is posted here by permission of ACM for your personal use. Not for redistribution. The definitive version was published in ACM Transactions on Graphics, VOL 35, ISS 4, July 2016. http://doi.acm.org/10.1145/2897824.2925873.},
title = {Real-time Facial Animation with Image-based Dynamic Avatars},
publisher = {Association for Computing Machinery},
year = {2016},
journal = {ACM Transactions on Graphics},
keywords = {facial animation; face tracking; virtual avatar; image-based rendering; hair modeling},
url = {https://eprints.whiterose.ac.uk/134265/},
abstract = {We present a novel image-based representation for dynamic 3D avatars, which allows effective handling of various hairstyles and headwear, and can generate expressive facial animations with fine-scale details in real-time. We develop algorithms for creating an image-based avatar from a set of sparsely captured images of a user, using an off-the-shelf web camera at home. An optimization method is proposed to construct a topologically consistent morphable model that approximates the dynamic hair geometry in the captured images. We also design a real-time algorithm for synthesizing novel views of an image-based avatar, so that the avatar follows the facial motions of an arbitrary actor. Compelling results from our pipeline are demonstrated on a variety of cases.}
}We introduce AutoHair, the first fully automatic method for 3D hair modeling from a single portrait image, with no user interaction or parameter tuning. Our method efficiently generates complete and high-quality hair geometries, which are comparable to those generated by the state-of-the-art methods, where user interaction is required. The core components of our method are: a novel hierarchical deep neural network for automatic hair segmentation and hair growth direction estimation, trained over an annotated hair image database; and an efficient and automatic data-driven hair matching and modeling algorithm, based on a large set of 3D hair exemplars. We demonstrate the efficacy and robustness of our method on Internet photos, resulting in a database of around 50K 3D hair models and a corresponding hairstyle space that covers a wide variety of real-world hairstyles. We also show novel applications enabled by our method, including 3D hairstyle space navigation and hair-aware image retrieval.
@article{wrro134268,
volume = {35},
number = {4},
month = {July},
author = {M Chai and T Shao and H Wu and Y Weng and K Zhou},
note = {{\copyright} ACM, 2016. This is the author's version of the work. It is posted here by permission of ACM for your personal use. Not for redistribution. The definitive version was published in ACM Transactions on Graphics, VOL 35, ISS 4, July 2016. http://doi.acm.org/10.1145/2897824.2925961.},
title = {AutoHair: Fully Automatic Hair Modeling from A Single Image},
publisher = {Association for Computing Machinery},
year = {2016},
journal = {ACM Transactions on Graphics},
keywords = {hair modeling; image segmentation; data-driven modeling; deep neural network},
url = {https://eprints.whiterose.ac.uk/134268/},
abstract = {We introduce AutoHair, the first fully automatic method for 3D hair modeling from a single portrait image, with no user interaction or parameter tuning. Our method efficiently generates complete and high-quality hair geometries, which are comparable to those generated by the state-of-the-art methods, where user interaction is required. The core components of our method are: a novel hierarchical deep neural network for automatic hair segmentation and hair growth direction estimation, trained over an annotated hair image database; and an efficient and automatic data-driven hair matching and modeling algorithm, based on a large set of 3D hair exemplars. We demonstrate the efficacy and robustness of our method on Internet photos, resulting in a database of around 50K 3D hair models and a corresponding hairstyle space that covers a wide variety of real-world hairstyles. We also show novel applications enabled by our method, including 3D hairstyle space navigation and hair-aware image retrieval.}
}Inferring the functionality of an object from a single RGBD image is difficult for two reasons: lack of semantic information about the object, and missing data due to occlusion. In this paper, we present an interactive framework to recover a 3D functional prototype from a single RGBD image. Instead of precisely reconstructing the object geometry for the prototype, we mainly focus on recovering the object?s functionality along with its geometry. Our system allows users to scribble on the image to create initial rough proxies for the parts. After user annotation of high-level relations between parts, our system automatically jointly optimizes detailed joint parameters (axis and position) and part geometry parameters (size, orientation, and position). Such prototype recovery enables a better understanding of the underlying image geometry and allows for further physically plausible manipulation. We demonstrate our framework on various indoor objects with simple or hybrid functions.
@article{wrro134217,
volume = {2},
number = {1},
month = {March},
author = {Y Rong and Y Zheng and T Shao and Y Yang and K Zhou},
note = {{\copyright} The Author(s) 2016. The articles published in this journal are distributed under the terms of the Creative Commons Attribution 4.0 International License (http://creativecommons.org/licenses/by/4.0/), which permits
unrestricted use, distribution, and reproduction in any medium, provided you give appropriate credit to the original author(s) and the source, provide a link to the Creative Commons license, and indicate if changes were made.},
title = {An Interactive Approach for Functional Prototype Recovery from a Single RGBD Image},
publisher = {Springer},
year = {2016},
journal = {Computational Visual Media},
pages = {87--96},
keywords = {functionality; cuboid proxy; prototype; part relations; shape analysis},
url = {https://eprints.whiterose.ac.uk/134217/},
abstract = {Inferring the functionality of an object from a single RGBD image is difficult for two reasons: lack of semantic information about the object, and missing data due to occlusion. In this paper, we present an interactive framework to recover a 3D functional prototype from a single RGBD image. Instead of precisely reconstructing the object geometry for the prototype, we mainly focus on recovering the object?s functionality along with its geometry. Our system allows users to scribble on the image to create initial rough proxies for the parts. After user annotation of high-level relations between parts, our system automatically jointly optimizes detailed joint parameters (axis and position) and part geometry parameters (size, orientation, and position). Such prototype recovery enables a better understanding of the underlying image geometry and allows for further physically plausible manipulation. We demonstrate our framework on various indoor objects with simple or hybrid functions.}
}Crowd simulation has been an active and important area of research in the field of interactive 3D graphics for several decades. However, only recently has there been an increased focus on evaluating the fidelity of the results with respect to real-world situations. The focus to date has been on analyzing the properties of low-level features such as pedestrian trajectories, or global features such as crowd densities. We propose a new approach based on finding latent Path Patterns in both real and simulated data in order to analyze and compare them. Unsupervised clustering by non-parametric Bayesian inference is used to learn the patterns, which themselves provide a rich visualization of the crowd's behaviour. To this end, we present a new Stochastic Variational Dual Hierarchical Dirichlet Process (SV-DHDP) model. The fidelity of the patterns is then computed with respect to a reference, thus allowing the outputs of different algorithms to be compared with each other and/or with real data accordingly.
@misc{wrro106101,
month = {February},
author = {H Wang and J Ond{\v r}ej and C O'Sullivan},
note = {{\copyright} 2016, The Authors. Publication rights licensed to ACM. This is the author's version of the work. It is posted here for your personal use. Not for redistribution. The definitive version was published in Proceedings of the 20th ACM SIGGRAPH Symposium on Interactive 3D Graphics and Games, https://doi.org/10.1145/2856400.2856410.},
booktitle = {I3D '16: 20th ACM SIGGRAPH Symposium on Interactive 3D Graphics and Games},
editor = {C Wyman and C Yuksel and SN Spencer},
title = {Path Patterns: Analyzing and Comparing Real and Simulated Crowds},
publisher = {ACM},
year = {2016},
journal = {Proceedings},
pages = {49--57},
keywords = {Crowd Simulation, Crowd Comparison, Data-Driven, Clustering, Hierarchical Dirichlet Process, Stochastic Optimization},
url = {https://eprints.whiterose.ac.uk/106101/},
abstract = {Crowd simulation has been an active and important area of research in the field of interactive 3D graphics for several decades. However, only recently has there been an increased focus on evaluating the fidelity of the results with respect to real-world situations. The focus to date has been on analyzing the properties of low-level features such as pedestrian trajectories, or global features such as crowd densities. We propose a new approach based on finding latent Path Patterns in both real and simulated data in order to analyze and compare them. Unsupervised clustering by non-parametric Bayesian inference is used to learn the patterns, which themselves provide a rich visualization of the crowd's behaviour. To this end, we present a new Stochastic Variational Dual Hierarchical Dirichlet Process (SV-DHDP) model. The fidelity of the patterns is then computed with respect to a reference, thus allowing the outputs of different algorithms to be compared with each other and/or with real data accordingly.}
}Interactive visualization plays a key role in the analysis of large datasets. It can help users to explore data, investigate hypotheses and find patterns. The easier and more tangible the interaction, the more likely it is to enhance understanding. This paper presents a tabletop Tangible User Interface (TUI) for interactive data visualization and offers two main contributions. First, we highlight the functional requirements for a data visualization interface and present a tabletop TUI that combines tangible objects with multi-touch interaction. Second, we compare the performance of the tabletop TUI and a multi-touch interface. The results show that participants found patterns faster with the TUI. This was due to the fact that they adopted a more effective strategy using the tabletop TUI than the multi-touch interface.
@misc{wrro92246,
month = {February},
author = {S Al-Megren and RA Ruddle},
note = {{\copyright} 2016 ACM. This is the author's version of the work. It is posted here by permission of ACM for your personal use. Not for redistribution. The definitive version was published in Proceedings of the TEI '16: Tenth International Conference on Tangible, Embedded, and Embodied Interaction, 2016 http://doi.acm.org/10.1145/2839462.2839464.},
booktitle = {10th International Conference on Tangible, Embedded and Embodied Interaction},
title = {Comparing Tangible and Multi-touch Interaction for Interactive Data Visualization Tasks},
publisher = {ACM},
year = {2016},
journal = {Proceedings of the TEI '16},
pages = {279--286},
keywords = {Tangible User Interface; tabletop display; visualization; tangible interaction; biological data; multi-touch},
url = {https://eprints.whiterose.ac.uk/92246/},
abstract = {Interactive visualization plays a key role in the analysis of large datasets. It can help users to explore data, investigate hypotheses and find patterns. The easier and more tangible the interaction, the more likely it is to enhance understanding. This paper presents a tabletop Tangible User Interface (TUI) for interactive data visualization and offers two main contributions. First, we highlight the functional requirements for a data visualization interface and present a tabletop TUI that combines tangible objects with multi-touch interaction. Second, we compare the performance of the tabletop TUI and a multi-touch interface. The results show that participants found patterns faster with the TUI. This was due to the fact that they adopted a more effective strategy using the tabletop TUI than the multi-touch interface.}
}This paper describes the design and evaluation of two generations of an interface for navigating datasets of gigapixel images that pathologists use to diagnose cancer. The interface design is innovative because users panned with an overview:detail view scale difference that was up to 57 times larger than established guidelines, and 1 million pixel ?thumbnail? overviews that leveraged the real-estate of high resolution workstation displays. The research involved experts performing real work (pathologists diagnosing cancer), using datasets that were up to 3150 times larger than those used in previous studies that involved navigating images. The evaluation provides evidence about the effectiveness of the interfaces, and characterizes how experts navigate gigapixel images when performing real work. Similar interfaces could be adopted in applications that use other types of high-resolution images (e.g., remote sensing or highthroughput microscopy).
@article{wrro91558,
volume = {23},
number = {1},
month = {February},
author = {RA Ruddle and RG Thomas and R Randell and P Quirke and D Treanor},
note = {{\copyright} ACM, 2016. This is the author's version of the work. It is posted here by permission of ACM for your personal use. Not for redistribution. The definitive version was published in ACM Transactions on Computer-Human Interaction, 23 (1), February 2016. http://doi.acm.org/10.1145/2834117.},
title = {The design and evaluation of interfaces for navigating gigapixel images in digital pathology},
publisher = {Association for Computing Machinery (ACM)},
year = {2016},
journal = {ACM Transactions on Computer-Human Interaction},
keywords = {Human-centered computing - Empirical studies in HCI; Humancentered computing - Interaction design theory, concepts and paradigms; Human-centered computing - Visualization systems and tools; Gigapixel images, navigation, pathology, overview+detail, zoomable user interface},
url = {https://eprints.whiterose.ac.uk/91558/},
abstract = {This paper describes the design and evaluation of two generations of an interface for navigating datasets of gigapixel images that pathologists use to diagnose cancer. The interface design is innovative because
users panned with an overview:detail view scale difference that was up to 57 times larger than established guidelines, and 1 million pixel ?thumbnail? overviews that leveraged the real-estate of high resolution
workstation displays. The research involved experts performing real work (pathologists diagnosing cancer), using datasets that were up to 3150 times larger than those used in previous studies that involved
navigating images. The evaluation provides evidence about the effectiveness of the interfaces, and characterizes how experts navigate gigapixel images when performing real work. Similar interfaces could
be adopted in applications that use other types of high-resolution images (e.g., remote sensing or highthroughput microscopy).}
}Scalar topology in the form of Morse theory has provided computational tools that analyze and visualize data from scientific and engineering tasks. Contracting isocontours to single points encapsulates variations in isocontour connectivity in the Reeb graph. For multivariate data, isocontours generalize to fibers{–}inverse images of points in the range, and this area is therefore known as fiber topology. However, fiber topology is less fully developed than Morse theory, and current efforts rely on manual visualizations. This paper presents how to accelerate and semi-automate this task through an interface for visualizing fiber singularities of multivariate functions R3 {$\rightarrow$} R2. This interface exploits existing conventions of fiber topology, but also introduces a 3D view based on the extension of Reeb graphs to Reeb spaces. Using the Joint Contour Net, a quantized approximation of the Reeb space, this accelerates topological visualization and permits online perturbation to reduce or remove degeneracies in functions under study. Validation of the interface is performed by assessing whether the interface supports the mathematical workflow both of experts and of less experienced mathematicians.
@article{wrro88921,
volume = {22},
number = {1},
month = {January},
author = {D Sakurai and O Saeki and H Carr and H-Y Wu and T Yamamoto and D Duke and S Takahashi},
note = {{\copyright} 2015, IEEE. Personal use of this material is permitted. Permission from IEEE must be obtained for all other uses, in any current or future media, including reprinting/republishing this material for advertising or promotional purposes, creating new collective works, for resale or redistribution to servers or lists, or reuse of any copyrighted component of this work in other works.},
title = {Interactive Visualization for Singular Fibers of Functions f : R3 {$\rightarrow$} R2},
publisher = {Institute of Electrical and Electronics Engineers},
year = {2016},
journal = {IEEE Transactions on Visualization and Computer Graphics},
pages = {945--954},
keywords = {singular fibers; fiber topology; mathematical visualization; design study},
url = {https://eprints.whiterose.ac.uk/88921/},
abstract = {Scalar topology in the form of Morse theory has provided computational tools that analyze and visualize data from scientific and engineering tasks. Contracting isocontours to single points encapsulates variations in isocontour connectivity in the Reeb graph. For multivariate data, isocontours generalize to fibers{--}inverse images of points in the range, and this area is therefore known as fiber topology. However, fiber topology is less fully developed than Morse theory, and current efforts rely on manual visualizations.
This paper presents how to accelerate and semi-automate this task through an interface for visualizing fiber singularities of multivariate functions R3 {$\rightarrow$} R2. This interface exploits existing conventions of fiber topology, but also introduces a 3D view based on the extension of Reeb graphs to Reeb spaces. Using the Joint Contour Net, a quantized approximation of the Reeb space, this accelerates topological visualization and permits online perturbation to reduce or remove degeneracies in functions under study. Validation of the interface is performed by assessing whether the interface supports the mathematical workflow both of experts and of less experienced mathematicians.}
}@article{wrro123473,
volume = {6},
number = {1},
month = {October},
author = {R Randell and RA Ruddle and RG Thomas and D Treanor},
note = {{\copyright} 2015 Journal of Pathology Informatics. This is an open access article distributed under the terms of the Creative Commons Attribution-NonCommercial-ShareAlike 3.0 License, which allows others to remix, tweak, and build upon the work non-commercially, as long as the author is credited and the new creations are licensed under the identical terms.},
title = {Response to Rojo and Bueno: ?Analysis of the impact of high resolution monitors in digital pathology?},
publisher = {Medknow Publications},
year = {2015},
journal = {Journal of Pathology Informatics},
url = {https://eprints.whiterose.ac.uk/123473/}
}Parallel implementation of topological algorithms is highly desirable, but the challenges, from reconstructing algorithms around independent threads through to runtime load balancing, have proven to be formidable. This problem, made all the more acute by the diversity of hardware platforms, has led to new kinds of implementation platform for computational science, with sophisticated runtime systems managing and coordinating large threadcounts to keep processing elements heavily utilized. While simpler and more portable than direct management of threads, these approaches still entangle program logic with resource management. Similar kinds of highly parallel runtime system have also been developed for functional languages. Here, however, language support for higher-order functions allows a cleaner separation between the algorithm and `skeletons' that express generic patterns of parallel computation. We report results on using this technique to develop a distributed version of the Joint Contour Net, a generalization of the Contour Tree to multifields. We present performance comparisons against a recent Haskell implementation using shared-memory parallelism, and initial work on a skeleton for distributed memory implementation that utilizes an innovative strategy to reduce inter-process communication overheads.
@misc{wrro88285,
month = {September},
author = {DJ Duke and F Hosseini},
note = {{\copyright} ACM Press, 2015. This is the author's version of the work. It is posted here by permission of ACM for your personal use. Not for redistribution. The definitive version was published in 2015, http://doi.acm.org/10.1145/2808091.2808095},
booktitle = {Functional High Performance Computing},
editor = {T Rompf and G Mainland},
title = {Skeletons for Distributed Topological Computation},
publisher = {ACM Press},
year = {2015},
journal = {FHPC 2015 Proceedings of the 4th ACM SIGPLAN Workshop on Functional High-Performance Computing},
pages = {35--44},
keywords = {Computational topology; Performance; Eden; Haskell},
url = {https://eprints.whiterose.ac.uk/88285/},
abstract = {Parallel implementation of topological algorithms is highly desirable, but the challenges, from reconstructing algorithms around independent threads through to runtime load balancing, have proven to be formidable. This problem, made all the more acute by the diversity of hardware platforms, has led to new kinds of implementation platform for computational science, with sophisticated runtime systems managing and coordinating large threadcounts to keep processing elements heavily utilized. While simpler and more portable than direct management of threads, these approaches still entangle program logic with resource management. Similar kinds of highly parallel runtime system have also been developed for functional languages. Here, however, language support for higher-order functions allows a cleaner separation between the algorithm and `skeletons' that express generic patterns of parallel computation. We report results on using this technique to develop a distributed version of the Joint Contour Net, a generalization of the Contour Tree to multifields. We present performance comparisons against a recent Haskell implementation using shared-memory parallelism, and initial work on a skeleton for distributed memory implementation that utilizes an innovative strategy to reduce inter-process communication overheads.}
}Background: Biomedical image processing methods require users to optimise input parameters to ensure high-quality output. This presents two challenges. First, it is difficult to optimise multiple input parameters for multiple input images. Second, it is difficult to achieve an understanding of underlying algorithms, in particular, relationships between input and output. Results: We present a visualisation method that transforms users? ability to understand algorithm behaviour by integrating input and output and supporting exploration of their relationships. We discuss its application to a colour deconvolution technique for stained histology images and show how it enabled a domain expert to identify suitable parameter values for the deconvolution of two types of images, and metrics to quantify deconvolution performance. It also enabled a breakthrough in understanding by invalidating an underlying assumption about the algorithm. Conclusions: The visualisation method presented here provides users with a capability to combine multiple inputs and outputs in biomedical image processing that is not provided by previous analysis software. The analysis supported by our method is not feasible with conventional trial-and-error approaches.
@article{wrro86634,
volume = {16},
number = {S11},
month = {August},
author = {AJ Pretorius and Y Zhou and RA Ruddle},
note = {{\copyright} 2015 Pretorius et al; licensee BioMed Central Ltd. This is an Open Access article distributed under the terms of the Creative Commons Attribution License (http://creativecommons.org/licenses/by/2.0), which permits unrestricted use, distribution, and reproduction in any medium, provided the original work is properly cited},
title = {Visual parameter optimisation for biomedical image processing},
publisher = {BioMed Central},
year = {2015},
journal = {BMC Bioinformatics},
keywords = {visualisation; parameter optimisation; image analysis; image processing; biology; biomedicine; histology; design study},
url = {https://eprints.whiterose.ac.uk/86634/},
abstract = {Background: Biomedical image processing methods require users to optimise input parameters to ensure high-quality output. This presents two challenges. First, it is difficult to optimise multiple input parameters for multiple input images. Second, it is difficult to achieve an understanding of underlying algorithms, in particular, relationships between input and output.
Results: We present a visualisation method that transforms users? ability to understand algorithm behaviour by integrating input and output and supporting exploration of their relationships. We discuss its application to a colour deconvolution technique for stained histology images and show how it enabled a domain expert to identify suitable parameter values for the deconvolution of two types of images, and metrics to quantify deconvolution performance. It also enabled a breakthrough in understanding by invalidating an underlying assumption about the algorithm.
Conclusions: The visualisation method presented here provides users with a capability to combine multiple inputs and outputs in biomedical image processing that is not provided by previous analysis software. The analysis supported by our method is not feasible with conventional trial-and-error approaches.}
}High-resolution, wall-size displays often rely on bespoke software for performing interactive data visualisation, leading to interface designs with little or no consistency between displays. This makes adoption for novice users difficult when migrating from desktop environments. However, desktop interface techniques (such as task- and menu- bars) do not scale well and so cannot be relied on to drive the design of large display interfaces. In this paper we present HiReD, a multi-window environment for cluster-driven displays. As well as describing the technical details of the system, we also describe a suite of low-precision interface techniques that aim to provide a familiar desktop environment to the user while overcoming the scalability issues of high-resolution displays. We hope that these techniques, as well as the implementation of HiReD itself, can encourage good practice in the design and development of future interfaces for high-resolution, wall-size displays.
@misc{wrro91514,
month = {August},
author = {C Rooney and RA Ruddle},
note = {{\copyright} ACM, 2015. This is the author's version of the work. It is posted here by permission of ACM for your personal use. Not for redistribution. The definitive version was published in EICS '15 Proceedings of the 7th ACM SIGCHI Symposium on Engineering Interactive Computing Systems (23 Jul 2015) http://dx.doi.org/10.1145/2774225.2774850.},
booktitle = {7th ACM SIGCHI Symposium on Engineering Interactive Computing Systems},
title = {HiReD: a high-resolution multi-window visualisation environment for cluster-driven displays},
publisher = {Association for Computing Machinery},
year = {2015},
journal = {EICS '15 Proceedings of the 7th ACM SIGCHI Symposium on Engineering Interactive Computing Systems},
pages = {2 -- 11},
keywords = {Powerwall; multi-window environment; user interface; high-resolution; low-precision; H.5.2.; user interfaces; windowing systems},
url = {https://eprints.whiterose.ac.uk/91514/},
abstract = {High-resolution, wall-size displays often rely on bespoke software for performing interactive data visualisation, leading to interface designs with little or no consistency between displays. This makes adoption for novice users difficult when migrating from desktop environments. However, desktop interface techniques (such as task- and menu- bars) do not scale well and so cannot be relied on to drive the design of large display interfaces. In this paper we present HiReD, a multi-window environment for cluster-driven displays. As well as describing the technical details of the system, we also describe a suite of low-precision interface techniques that aim to provide a familiar desktop environment to the user while overcoming the scalability issues of high-resolution displays. We hope that these techniques, as well as the implementation of HiReD itself, can encourage good practice in the design and development of future interfaces for high-resolution, wall-size displays.}
}Scientific visualization has many effective methods for examining and exploring scalar and vector fields, but rather fewer for bivariate fields. We report the first general purpose approach for the interactive extraction of geometric separating surfaces in bivariate fields. This method is based on fiber surfaces: surfaces constructed from sets of fibers, the multivariate analogues of isolines. We show simple methods for fiber surface definition and extraction. In particular, we show a simple and efficient fiber surface extraction algorithm based on Marching Cubes. We also show how to construct fiber surfaces interactively with geometric primitives in the range of the function. We then extend this to build user interfaces that generate parameterized families of fiber surfaces with respect to arbitrary polygons. In the special case of isovalue-gradient plots, fiber surfaces capture features geometrically for quantitative analysis that have previously only been analysed visually and qualitatively using multi-dimensional transfer functions in volume rendering. We also demonstrate fiber surface extraction on a variety of bivariate data.
@article{wrro86871,
volume = {34},
number = {3},
month = {June},
author = {HA Carr and Z Geng and J Tierny and A Chattopadhyay and A Knoll},
note = {{\copyright} 2015 The Author(s) Computer Graphics Forum {\copyright} 2015 The Eurographics Association and John Wiley \& Sons Ltd. Published by John Wiley \& Sons Ltd. This is the peer reviewed version of the following article: Carr, H., Geng, Z., Tierny, J., Chattopadhyay, A. and Knoll, A. (2015), Fiber Surfaces: Generalizing Isosurfaces to Bivariate Data. Computer Graphics Forum, 34: 241?250. doi: 10.1111/cgf.12636, which has been published in final form at http://dx.doi.org/10.1111/cgf.12636. This article may be used for non-commercial purposes in accordance with Wiley Terms and Conditions for Self-Archiving.},
title = {Fiber surfaces: generalizing isosurfaces to bivariate data},
publisher = {Wiley},
year = {2015},
journal = {Computer Graphics Forum},
pages = {241--250},
url = {https://eprints.whiterose.ac.uk/86871/},
abstract = {Scientific visualization has many effective methods for examining and exploring scalar and vector fields, but rather fewer for bivariate fields. We report the first general purpose approach for the interactive extraction of geometric separating surfaces in bivariate fields. This method is based on fiber surfaces: surfaces constructed from sets of fibers, the multivariate analogues of isolines. We show simple methods for fiber surface definition and extraction. In particular, we show a simple and efficient fiber surface extraction algorithm based on Marching Cubes. We also show how to construct fiber surfaces interactively with geometric primitives in the range of the function. We then extend this to build user interfaces that generate parameterized families of fiber surfaces with respect to arbitrary polygons. In the special case of isovalue-gradient plots, fiber surfaces capture features geometrically for quantitative analysis that have previously only been analysed visually and qualitatively using multi-dimensional transfer functions in volume rendering. We also demonstrate fiber surface extraction on a variety of bivariate data.}
}Airborne Laser Scanning (ALS) was introduced to provide rapid, high resolution scans of landforms for computational processing. More recently, ALS has been adapted for scanning urban areas. The greater complexity of urban scenes necessitates the development of novel methods to exploit urban ALS to best advantage. This paper presents occlusion images: a novel technique that exploits the geometric complexity of the urban environment to improve visualisation of small details for better feature recognition. The algorithm is based on an inversion of traditional occlusion techniques.
@article{wrro97575,
volume = {104},
month = {June},
author = {T Hinks and H Carr and H Gharibi and DF Laefer},
note = {{\copyright} 2015 International Society for Photogrammetry and Remote Sensing, Inc. (ISPRS). Published by Elsevier B.V. This is an author produced version of a paper published in ISPRS Journal of Photogrammetry and Remote Sensing. Uploaded in accordance with the publisher's self-archiving policy.},
title = {Visualisation of urban airborne laser scanning data with occlusion images},
publisher = {Elsevier},
year = {2015},
journal = {ISPRS Journal of Photogrammetry and Remote Sensing},
pages = {77--87},
keywords = {Airborne laser scanning; LiDAR; Ambient occlusion; Urban modelling; Elevation image; Visualisation},
url = {https://eprints.whiterose.ac.uk/97575/},
abstract = {Airborne Laser Scanning (ALS) was introduced to provide rapid, high resolution scans of landforms for computational processing. More recently, ALS has been adapted for scanning urban areas. The greater complexity of urban scenes necessitates the development of novel methods to exploit urban ALS to best advantage. This paper presents occlusion images: a novel technique that exploits the geometric complexity of the urban environment to improve visualisation of small details for better feature recognition. The algorithm is based on an inversion of traditional occlusion techniques.}
}Large, high-resolution displays (LHRDs) allow orders of magnitude more data to be visualized at a time than ordinary computer displays. Previous research is inconclusive about the circumstances under which LHRDs are beneficial and lacks behavioural data to explain inconsistencies in the findings. We conducted an experiment in which participants searched maps for densely or sparsely distributed targets, using 2 million pixel (0.4m {$\times$} 0.3m), 12 million pixel (1.3m {$\times$} 0.7m) and 54 million pixel displays (3.0m {$\times$} 1.3m). Display resolution did not affect the speed at which dense targets were found, but participants found sparse targets in easily identifiable regions of interest 30\% faster with the 54-million pixel display than with the other displays. This was because of the speed advantage conferred by physical navigation and the fact that the whole dataset fitted onto the 54-million pixel display. Contrary to expectations, participants found targets at a similar speed and interacted in a similar manner (mostly short panning movements) with the 2- and 12-million pixel displays even though the latter provided more opportunity for physical navigation, though this may have been because panning used velocity-based control. We are applying these findings to the design of a virtual microscope for the diagnosis of diseases such as cancer.
@article{wrro85118,
volume = {14},
number = {2},
month = {April},
author = {RA Ruddle and RG Thomas and RS Randell and P Quirke and D Treanor},
note = {(c) 2013, The Author(s). This is an author produced version of a paper published in Information Visualization. Uploaded in accordance with the publisher's self-archiving policy.},
title = {Performance and interaction behaviour during visual search on large, high-resolution displays.},
publisher = {SAGE},
year = {2015},
journal = {Information Visualization},
pages = {137 -- 147},
keywords = {Large high-resolution displays, gigapixel images, interaction behaviour, physical navigation, visual search, histopathology},
url = {https://eprints.whiterose.ac.uk/85118/},
abstract = {Large, high-resolution displays (LHRDs) allow orders of magnitude more data to be visualized at a time than ordinary computer displays. Previous research is inconclusive about the circumstances under which LHRDs are beneficial and lacks behavioural data to explain inconsistencies in the findings. We conducted an experiment in which participants searched maps for densely or sparsely distributed targets, using 2 million pixel (0.4m {$\times$} 0.3m), 12 million pixel (1.3m {$\times$} 0.7m) and 54 million pixel displays (3.0m {$\times$} 1.3m). Display resolution did not affect the speed at which dense targets were found, but participants found sparse targets in easily identifiable regions of interest 30\% faster with the 54-million pixel display than with the other displays. This was because of the speed advantage conferred by physical navigation and the fact that the whole dataset fitted onto the 54-million pixel display. Contrary to expectations, participants found targets at a similar speed and interacted in a similar manner (mostly short panning movements) with the 2- and 12-million pixel displays even though the latter provided more opportunity for physical navigation, though this may have been because panning used velocity-based control. We are applying these findings to the design of a virtual microscope for the diagnosis of diseases such as cancer.}
}Understanding the mechanisms of induced nuclear fission for a broad range of neutron energies could help resolve fundamental science issues, such as the formation of elements in the universe, but could have also a large impact on societal applications in energy production or nuclear waste management. The goal of this paper is to set up the foundations of a microscopic theory to study the static aspects of induced fission as a function of the excitation energy of the incident neutron, from thermal to fast neutrons. To account for the high excitation energy of the compound nucleus, we employ a statistical approach based on finite temperature nuclear density functional theory with Skyrme energy densities, which we benchmark on the Pu239(n,f) reaction. We compute the evolution of the least-energy fission pathway across multidimensional potential energy surfaces with up to five collective variables as a function of the nuclear temperature and predict the evolution of both the inner and the outer fission barriers as a function of the excitation energy of the compound nucleus. We show that the coupling to the continuum induced by the finite temperature is negligible in the range of neutron energies relevant for many applications of neutron-induced fission. We prove that the concept of quantum localization introduced recently can be extended to T{\ensuremath{>}}0, and we apply the method to study the interaction energy and total kinetic energy of fission fragments as a function of the temperature for the most probable fission. While large uncertainties in theoretical modeling remain, we conclude that a finite temperature nuclear density functional may provide a useful framework to obtain accurate predictions of fission fragment properties.
@article{wrro84783,
volume = {91},
number = {3},
month = {March},
author = {N Schunck and DJ Duke and H Carr},
note = {{\copyright} 2015, American Physical Society. Reproduced in accordance with the publisher's self-archiving policy.},
title = {Description of induced nuclear fission with Skyrme energy functionals. II. Finite temperature effects},
publisher = {American Physical Society},
year = {2015},
journal = {Physical Review C: Nuclear Physics},
keywords = {Fission; Topology; Joint Contour Net},
url = {https://eprints.whiterose.ac.uk/84783/},
abstract = {Understanding the mechanisms of induced nuclear fission for a broad range of neutron energies could help resolve fundamental science issues, such as the formation of elements in the universe, but could have also a large impact on societal applications in energy production or nuclear waste management. The goal of this paper is to set up the foundations of a microscopic theory to study the static aspects of induced fission as a function of the excitation energy of the incident neutron, from thermal to fast neutrons. To account for the high excitation energy of the compound nucleus, we employ a statistical approach based on finite temperature nuclear density functional theory with Skyrme energy densities, which we benchmark on the Pu239(n,f) reaction. We compute the evolution of the least-energy fission pathway across multidimensional potential energy surfaces with up to five collective variables as a function of the nuclear temperature and predict the evolution of both the inner and the outer fission barriers as a function of the excitation energy of the compound nucleus. We show that the coupling to the continuum induced by the finite temperature is negligible in the range of neutron energies relevant for many applications of neutron-induced fission. We prove that the concept of quantum localization introduced recently can be extended to T{\ensuremath{>}}0, and we apply the method to study the interaction energy and total kinetic energy of fission fragments as a function of the temperature for the most probable fission. While large uncertainties in theoretical modeling remain, we conclude that a finite temperature nuclear density functional may provide a useful framework to obtain accurate predictions of fission fragment properties.}
}Cellular pathologists are doctors who diagnose disease by using a microscope to examine glass slides containing thin sections of human tissue. These slides can be digitised and viewed on a computer, promising benefits in both efficiency and safety. Despite this, uptake of digital pathology for diagnostic work has been slow, with use largely restricted to second opinions, education, and external quality assessment schemes. To understand the barriers and facilitators to the introduction of digital pathology, we have undertaken an interview study with nine consultant pathologists. Interviewees were able to identify a range of potential benefits of digital pathology, with a particular emphasis on easier access to slides. Amongst the barriers to use, a key concern was lack of familiarity, not only in terms of becoming familiar with the technology but learning how to adjust their diagnostic skills to this new medium. The findings emphasise the need to ensure adequate training and support and the potential benefit of allowing parallel use of glass slides and digital while pathologists are on the learning curve.
@article{wrro86602,
volume = {216},
month = {March},
author = {RS Randell and RA Ruddle and D Treanor},
note = {{\copyright} 2015, Author(s). This is an author produced version of a paper published in Studies in Health Technology and Informatics. Uploaded in accordance with the publisher's self-archiving policy.},
title = {Barriers and facilitators to the introduction of digital pathology for diagnostic work},
publisher = {IOS Press},
year = {2015},
journal = {Studies in Health Technology and Informatics},
pages = {443 -- 447},
keywords = {Informatics; Pathology; Microscopy; Qualitative Research; Learning Curve},
url = {https://eprints.whiterose.ac.uk/86602/},
abstract = {Cellular pathologists are doctors who diagnose disease by using a microscope to examine glass slides containing thin sections of human tissue. These slides can be digitised and viewed on a computer, promising benefits in both efficiency and safety. Despite this, uptake of digital pathology for diagnostic work has been slow, with use largely restricted to second opinions, education, and external quality assessment schemes. To understand the barriers and facilitators to the introduction of digital pathology, we have undertaken an interview study with nine consultant pathologists. Interviewees were able to identify a range of potential benefits of digital pathology, with a particular emphasis on easier access to slides. Amongst the barriers to use, a key concern was lack of familiarity, not only in terms of becoming familiar with the technology but learning how to adjust their diagnostic skills to this new medium. The findings emphasise the need to ensure adequate training and support and the potential benefit of allowing parallel use of glass slides and digital while pathologists are on the learning curve.}
}In this paper, we present a local motion planning algorithm for character animation. We focus on motion planning between two distant postures where linear interpolation leads to penetrations. Our framework has two stages. The motion planning problem is first solved as a Boundary Value Problem (BVP) on an energy graph which encodes penetrations, motion smoothness and user control. Having established a mapping from the configuration space to the energy graph, a fast and robust local motion planning algorithm is introduced to solve the BVP to generate motions that could only previously be computed by global planning methods. In the second stage, a projection of the solution motion onto a constraint manifold is proposed for more user control. Our method can be integrated into current keyframing techniques. It also has potential applications in motion planning problems in robotics.
@article{wrro106108,
volume = {21},
number = {1},
month = {January},
author = {H Wang and ESL Ho and T Komura},
note = {{\copyright} 2014 IEEE. Personal use of this material is permitted. Permission from IEEE must be obtained for all other users, including reprinting/ republishing this material for advertising or promotional purposes, creating new collective works for resale or redistribution to servers or lists, or reuse of any copyrighted components of this work in other works.},
title = {An energy-driven motion planning method for two distant postures},
publisher = {https://doi.org/10.1109/TVCG.2014.2327976},
year = {2015},
journal = {IEEE Transactions on Visualization and Computer Graphics},
pages = {18--30},
keywords = {Planning; Interpolation; Equations; Couplings; Animation; Manifolds; Joints},
url = {https://eprints.whiterose.ac.uk/106108/},
abstract = {In this paper, we present a local motion planning algorithm for character animation. We focus on motion planning between two distant postures where linear interpolation leads to penetrations. Our framework has two stages. The motion planning problem is first solved as a Boundary Value Problem (BVP) on an energy graph which encodes penetrations, motion smoothness and user control. Having established a mapping from the configuration space to the energy graph, a fast and robust local motion planning algorithm is introduced to solve the BVP to generate motions that could only previously be computed by global planning methods. In the second stage, a projection of the solution motion onto a constraint manifold is proposed for more user control. Our method can be integrated into current keyframing techniques. It also has potential applications in motion planning problems in robotics.}
}Performing diagnoses using virtual slides can take pathologists significantly longer than with glass slides, presenting a significant barrier to the use of virtual slides in routine practice. Given the benefits in pathology workflow efficiency and safety that virtual slides promise, it is important to understand reasons for this difference and identify opportunities for improvement. The effect of display resolution on time to diagnosis with virtual slides has not previously been explored. The aim of this study was to assess the effect of display resolution on time to diagnosis with virtual slides. Nine pathologists participated in a counterbalanced crossover study, viewing axillary lymph node slides on a microscope, a 23-in 2.3-megapixel single-screen display and a three-screen 11-megapixel display consisting of three 27-in displays. Time to diagnosis and time to first target were faster on the microscope than on the single and three-screen displays. There was no significant difference between the microscope and the three-screen display in time to first target, while the time taken on the single-screen display was significantly higher than that on the microscope. The results suggest that a digital pathology workstation with an increased number of pixels may make it easier to identify where cancer is located in the initial slide overview, enabling quick location of diagnostically relevant regions of interest. However, when a comprehensive, detailed search of a slide has to be made, increased resolution may not offer any additional benefit.
@article{wrro80899,
volume = {28},
number = {1},
author = {R Randell and T Ambepitiya and C Mello-Thoms and RA Ruddle and D Brettle and RG Thomas and D Treanor},
note = {{\copyright} Society for Imaging Informatics in Medicine 2014. This is an author produced version of a paper accepted for publication in Journal of Digital Imaging. Uploaded in accordance with the publisher's self-archiving policy. The final publication is available at Springer via http://dx.doi.org/10.1007/s10278-014-9726-8},
title = {Effect of display resolution on time to diagnosis with virtual pathology slides in a systematic search task},
publisher = {Springer Verlag},
year = {2015},
journal = {Journal of Digital Imaging},
pages = {68 -- 76},
keywords = {Digital pathology; Pathology; Virtual slides; Whole slide imaging; Telepathology; Time to diagnosis},
url = {https://eprints.whiterose.ac.uk/80899/},
abstract = {Performing diagnoses using virtual slides can take pathologists significantly longer than with glass slides, presenting a significant barrier to the use of virtual slides in routine practice. Given the benefits in pathology workflow efficiency and safety that virtual slides promise, it is important to understand reasons for this difference and identify opportunities for improvement. The effect of display resolution on time to diagnosis with virtual slides has not previously been explored. The aim of this study was to assess the effect of display resolution on time to diagnosis with virtual slides. Nine pathologists participated in a counterbalanced crossover study, viewing axillary lymph node slides on a microscope, a 23-in 2.3-megapixel single-screen display and a three-screen 11-megapixel display consisting of three 27-in displays. Time to diagnosis and time to first target were faster on the microscope than on the single and three-screen displays. There was no significant difference between the microscope and the three-screen display in time to first target, while the time taken on the single-screen display was significantly higher than that on the microscope. The results suggest that a digital pathology workstation with an increased number of pixels may make it easier to identify where cancer is located in the initial slide overview, enabling quick location of diagnostically relevant regions of interest. However, when a comprehensive, detailed search of a slide has to be made, increased resolution may not offer any additional benefit.}
}Missing data due to occlusion is a key challenge in 3D acquisition, particularly in cluttered man-made scenes. Such partial information about the scenes limits our ability to analyze and understand them. In this work we abstract such environments as collections of cuboids and hallucinate geometry in the occluded regions by globally analyzing the physical stability of the resultant arrangements of the cuboids. Our algorithm extrapolates the cuboids into the un-seen regions to infer both their corresponding geometric attributes (e.g., size, orientation) and how the cuboids topologically interact with each other (e.g., touch or fixed). The resultant arrangement provides an abstraction for the underlying structure of the scene that can then be used for a range of common geometry processing tasks. We evaluate our algorithm on a large number of test scenes with varying complexity, validate the results on existing benchmark datasets, and demonstrate the use of the recovered cuboid-based structures towards object retrieval, scene completion, etc.
@article{wrro134270,
volume = {33},
number = {6},
month = {November},
author = {T Shao and A Monszpart and Y Zheng and B Koo and W Xu and K Zhou and NJ Mitra},
note = {{\copyright} 2014, Association for Computing Machinery, Inc. This is the author's version of the work. It is posted here for your personal use. Not for redistribution. The definitive Version of Record was published in ACM Transactions on Graphics, https://doi.org/10.1145/10.1145/2661229.2661288. Uploaded in accordance with the publisher's self-archiving policy.},
title = {Imagining the unseen: stability-based cuboid arrangements for scene understanding},
publisher = {Association for Computing Machinery},
year = {2014},
journal = {ACM Transactions on Graphics},
keywords = {box world; proxy arrangements; physical stability; shape analysis},
url = {https://eprints.whiterose.ac.uk/134270/},
abstract = {Missing data due to occlusion is a key challenge in 3D acquisition, particularly in cluttered man-made scenes. Such partial information about the scenes limits our ability to analyze and understand them. In this work we abstract such environments as collections of cuboids and hallucinate geometry in the occluded regions by globally analyzing the physical stability of the resultant arrangements of the cuboids. Our algorithm extrapolates the cuboids into the un-seen regions to infer both their corresponding geometric attributes (e.g., size, orientation) and how the cuboids topologically interact with each other (e.g., touch or fixed). The resultant arrangement provides an abstraction for the underlying structure of the scene that can then be used for a range of common geometry processing tasks. We evaluate our algorithm on a large number of test scenes with varying complexity, validate the results on existing benchmark datasets, and demonstrate the use of the recovered cuboid-based structures towards object retrieval, scene completion, etc.}
}Synthesizing close interactions such as dancing and fighting between characters is a challenging problem in computer animation. While encouraging results are presented in [Ho et al. 2010], the high computation cost makes the method unsuitable for interactive motion editing and synthesis. In this paper, we propose an efficient multiresolution approach in the temporal domain for editing and adapting close character interactions based on the Interaction Mesh framework. In particular, we divide the original large spacetime optimization problem into multiple smaller problems such that the user can observe the adapted motion while playing-back the movements during run-time. Our approach is highly parallelizable, and achieves high performance by making use of multi-core architectures. The method can be applied to a wide range of applications including motion editing systems for animators and motion retargeting systems for humanoid robots.
@misc{wrro106110,
month = {November},
author = {ESL Ho and H Wang and T Komura},
note = {{\copyright} 2014 ACM. This is the author's version of the work. It is posted here by permission of ACM for your personal use. Not for redistribution. The definitive version was published in VRST '14 Proceedings of the 20th ACM Symposium on Virtual Reality Software and Technology, http://doi.acm.org/10.1145/2671015.2671020. Uploaded in accordance with the publisher's self-archiving policy.},
booktitle = {20th ACM Symposium on Virtual Reality Software and Technology (VRST 14)},
title = {A multi-resolution approach for adapting close character interaction},
publisher = {ACM},
year = {2014},
journal = {Proceedings},
pages = {97--106},
keywords = {Character animation, close interaction, spacetime constraints},
url = {https://eprints.whiterose.ac.uk/106110/},
abstract = {Synthesizing close interactions such as dancing and fighting between characters is a challenging problem in computer animation. While encouraging results are presented in [Ho et al. 2010], the high computation cost makes the method unsuitable for interactive motion editing and synthesis. In this paper, we propose an efficient multiresolution approach in the temporal domain for editing and adapting close character interactions based on the Interaction Mesh framework. In particular, we divide the original large spacetime optimization problem into multiple smaller problems such that the user can observe the adapted motion while playing-back the movements during run-time. Our approach is highly parallelizable, and achieves high performance by making use of multi-core architectures. The method can be applied to a wide range of applications including motion editing systems for animators and motion retargeting systems for humanoid robots.}
}Eighty years after its experimental discovery, a description of induced nuclear fission based solely on the interactions between neutrons and protons and quantum many-body methods still poses formidable challenges. The goal of this paper is to contribute to the development of a predictive microscopic framework for the accurate calculation of static properties of fission fragments for hot fission and thermal or slow neutrons. To this end, we focus on the Pu239(n,f) reaction and employ nuclear density functional theory with Skyrme energy densities. Potential energy surfaces are computed at the Hartree-Fock-Bogoliubov approximation with up to five collective variables. We find that the triaxial degree of freedom plays an important role, both near the fission barrier and at scission. The impact of the parametrization of the Skyrme energy density and the role of pairing correlations on deformation properties from the ground state up to scission are also quantified. We introduce a general template for the quantitative description of fission fragment properties. It is based on the careful analysis of scission configurations, using both advanced topological methods and recently proposed quantum many-body techniques. We conclude that an accurate prediction of fission fragment properties at low incident neutron energies, although technologically demanding, should be within the reach of current nuclear density functional theory.
@article{wrro81690,
volume = {90},
number = {5},
month = {November},
author = {N Schunck and DJ Duke and H Carr and A Knoll},
note = {(c) 2014, American Physical Society. Reproduced in accordance with the publisher's self-archiving policy.},
title = {Description of induced nuclear fission with Skyrme energy functionals: static potential energy surfaces and fission fragment properties},
publisher = {American Physical Society},
year = {2014},
journal = {Physical Review C: Nuclear Physics},
url = {https://eprints.whiterose.ac.uk/81690/},
abstract = {Eighty years after its experimental discovery, a description of induced nuclear fission based solely on the interactions between neutrons and protons and quantum many-body methods still poses formidable challenges. The goal of this paper is to contribute to the development of a predictive microscopic framework for the accurate calculation of static properties of fission fragments for hot fission and thermal or slow neutrons. To this end, we focus on the Pu239(n,f) reaction and employ nuclear density functional theory with Skyrme energy densities. Potential energy surfaces are computed at the Hartree-Fock-Bogoliubov approximation with up to five collective variables. We find that the triaxial degree of freedom plays an important role, both near the fission barrier and at scission. The impact of the parametrization of the Skyrme energy density and the role of pairing correlations on deformation properties from the ground state up to scission are also quantified. We introduce a general template for the quantitative description of fission fragment properties. It is based on the careful analysis of scission configurations, using both advanced topological methods and recently proposed quantum many-body techniques. We conclude that an accurate prediction of fission fragment properties at low incident neutron energies, although technologically demanding, should be within the reach of current nuclear density functional theory.}
}Digital pathology promises a number of benefits in efficiency in surgical pathology, yet the longer time required to review a virtual slide than a glass slide currently represents a significant barrier to the routine use of digital pathology. We aimed to create a novel workstation that enables pathologists to view a case as quickly as on the conventional microscope. The Leeds Virtual Microscope (LVM) was evaluated using a mixed factorial experimental design. Twelve consultant pathologists took part, each viewing one long cancer case (12-25 slides) on the LVM and one on a conventional microscope. Total time taken and diagnostic confidence were similar for the microscope and LVM, as was the mean slide viewing time. On the LVM, participants spent a significantly greater proportion of the total task time viewing slides and revisited slides more often. The unique design of the LVM, enabling real-time rendering of virtual slides while providing users with a quick and intuitive way to navigate within and between slides, makes use of digital pathology in routine practice a realistic possibility. With further practice with the system, diagnostic efficiency on the LVM is likely to increase yet more.
@article{wrro80933,
volume = {45},
number = {10},
month = {October},
author = {R Randell and RA Ruddle and RG Thomas and C Mello-Thoms and D Treanor},
note = {{\copyright} 2014, WB Saunders. This is an author produced version of a paper published in Human Pathology. Uploaded in accordance with the publisher's self-archiving policy.},
title = {Diagnosis of major cancer resection specimens with virtual slides: Impact of a novel digital pathology workstation},
publisher = {W.B. Saunders},
year = {2014},
journal = {Human Pathology},
pages = {2101--2106},
keywords = {Digital pathology; Telepathology; Time to diagnosis; Virtual slides; Whole slide imaging},
url = {https://eprints.whiterose.ac.uk/80933/},
abstract = {Digital pathology promises a number of benefits in efficiency in surgical pathology, yet the longer time required to review a virtual slide than a glass slide currently represents a significant barrier to the routine use of digital pathology. We aimed to create a novel workstation that enables pathologists to view a case as quickly as on the conventional microscope. The Leeds Virtual Microscope (LVM) was evaluated using a mixed factorial experimental design. Twelve consultant pathologists took part, each viewing one long cancer case (12-25 slides) on the LVM and one on a conventional microscope. Total time taken and diagnostic confidence were similar for the microscope and LVM, as was the mean slide viewing time. On the LVM, participants spent a significantly greater proportion of the total task time viewing slides and revisited slides more often. The unique design of the LVM, enabling real-time rendering of virtual slides while providing users with a quick and intuitive way to navigate within and between slides, makes use of digital pathology in routine practice a realistic possibility. With further practice with the system, diagnostic efficiency on the LVM is likely to increase yet more.}
}Evaluation, solved and unsolved problems, and future directions are popular themes pervading the visualization community over the last decade. The top unsolved problem in both scientific and information visualization was the subject of an IEEE Visualization Conference panel in 2004. The future of graphics hardware was another important topic of discussion the same year. The subject of how to evaluate visualization returned a few years later. Chris Johnson published a list of 10 top problems in scientific visualization research. This was followed up by report of both past achievements and future challenges in visualization research as well as financial support recommendations to the National Science Foundation (NSF) and National Institute of Health (NIH). Chen recently published the first list of top unsolved information visualization problems. Future research directions of topology-based visualization was also a major theme of a workshop on topology-based methods. Laramee and Kosara published a list of top future challenges in human-centered visualization.
@incollection{wrro144593,
volume = {37},
month = {September},
author = {RS Laramee and H Carr and M Chen and H Hauser and L Linsen and K Mueller and V Natarajan and H Obermaier and R Peikert and E Zhang},
series = {Mathematics and Visualization},
note = {{\copyright} Springer-Verlag London 2014. This is a post-peer-review, pre-copyedited version of book chapter published in Scientific Visualization. The final authenticated version is available online at: https://doi.org/10.1007/978-1-4471-6497-5\_19},
title = {Future Challenges and Unsolved Problems in Multi-field Visualization},
publisher = {Springer, London},
year = {2014},
journal = {Mathematics and Visualization},
pages = {205--211},
keywords = {Tensor Field; Graphic Hardware; Display Primary; Scientific Visualization; Visual Metaphor},
url = {https://eprints.whiterose.ac.uk/144593/},
abstract = {Evaluation, solved and unsolved problems, and future directions are popular themes pervading the visualization community over the last decade. The top unsolved problem in both scientific and information visualization was the subject of an IEEE Visualization Conference panel in 2004. The future of graphics hardware was another important topic of discussion the same year. The subject of how to evaluate visualization returned a few years later. Chris Johnson published a list of 10 top problems in scientific visualization research. This was followed up by report of both past achievements and future challenges in visualization research as well as financial support recommendations to the National Science Foundation (NSF) and National Institute of Health (NIH). Chen recently published the first list of top unsolved information visualization problems. Future research directions of topology-based visualization was also a major theme of a workshop on topology-based methods. Laramee and Kosara published a list of top future challenges in human-centered visualization.}
}Codes for computational science and downstream analysis (visualization and/or statistical modelling) have historically been dominated by imperative thinking, but this situation is evolving, both through adoption of higher-level tools such as Matlab, and through some adoption of functional ideas in the next generation of toolkits being driven by the vision of extreme-scale computing. However, this is still a long way from seeing a functional language like Haskell used in a live application. This paper makes three contributions to functional programming in computational science. First, we describe how use of Haskell was interleaved in the development of the first practical approach to multifield topology, and its application to the analysis of data from nuclear simulations that has led to new insight into fission. Second, we report subsequent developments of the functional code (i) improving sequential performance to approach that of an imperative implementation, and (ii) the introduction of parallelism through four skeletons exhibiting good scaling and different time/space trade-offs. Finally we consider the broader question of how, where, and why functional programming may - or may not - find further use in computational science.
@misc{wrro79906,
month = {September},
author = {DJ Duke and F Hosseini and H Carr},
booktitle = {The 3rd ACM SIGPLAN Workshop on Functional High-Performance Computing},
editor = {M Sheeran and R Newton},
title = {Parallel Computation of Multifield Topology: Experience of Haskell in a Computational Science Application},
publisher = {ACM Press},
year = {2014},
journal = {Proceedings of the ACM Workshop on Functional High-Performance Computing},
pages = {11--21},
keywords = {Computational topology; joint contour net; Haskell; performance},
url = {https://eprints.whiterose.ac.uk/79906/},
abstract = {Codes for computational science and downstream analysis (visualization and/or statistical modelling) have historically been dominated by imperative thinking, but this situation is evolving, both through adoption of higher-level tools such as Matlab, and through some adoption of functional ideas in the next generation of toolkits being driven by the vision of extreme-scale computing. However, this is still a long way from seeing a functional language like Haskell used in a live application. This paper makes three contributions to functional programming in computational science. First, we describe how use of Haskell was interleaved in the development of the first practical approach to multifield topology, and its application to the analysis of data from nuclear simulations that has led to new insight into fission. Second, we report subsequent developments of the functional code (i) improving sequential performance to approach that of an imperative implementation, and (ii) the introduction of parallelism through four skeletons exhibiting good scaling and different time/space trade-offs. Finally we consider the broader question of how, where, and why functional programming may - or may not - find further use in computational science.}
}The orientation of fibers in assemblies such as nonwovens has a major influence on the anisotropy of properties of the bulk structure and is strongly influenced by the processes used to manufacture the fabric. To build a detailed understanding of a fabric?s geometry and architecture it is important that fiber orientation in three dimensions is evaluated since out-of-plane orientations may also contribute to the physical properties of the fabric. In this study, a technique for measuring fiber segment orientation as proposed by Eberhardt and Clarke is implemented and experimentally studied based on analysis of X-ray computed microtomographic data. Fiber segment orientation distributions were extracted from volumetric X-ray microtomography data sets of hydroentangled nonwoven fabrics manufactured from parallel-laid, cross-laid, and air-laid webs. Spherical coordinates represented the orientation of individual fibers. Physical testing of the samples by means of zero-span tensile testing and z-directional tensile testing was employed to compare with the computed results.
@article{wrro83459,
volume = {20},
number = {4},
month = {August},
author = {M Tausif and B Duffy and H Carr and S Grishanov and SJ Russell},
note = {{\copyright} Microscopy Society of America 2014. This is an author produced version of a paper published in Microscopy and Microanalysis. Uploaded in accordance with the publisher's self-archiving policy},
title = {Three-Dimensional Fiber Segment Orientation Distribution Using X-Ray Microtomography},
publisher = {Cambridge University Press},
year = {2014},
journal = {Microscopy and Microanalysis},
pages = {1294--1303},
keywords = {Orientation distribution; Fiber; Nonwovens; Three dimensional; X-ray microtomography; Structure; Hydroentanglement},
url = {https://eprints.whiterose.ac.uk/83459/},
abstract = {The orientation of fibers in assemblies such as nonwovens has a major influence on the anisotropy of properties of the bulk structure and is strongly influenced by the processes used to manufacture the fabric. To build a detailed understanding of a fabric?s geometry and architecture it is important that fiber orientation in three dimensions is evaluated since out-of-plane orientations may also contribute to the physical properties of the fabric. In this study, a technique for measuring fiber segment orientation as proposed by Eberhardt and Clarke is implemented and experimentally studied based on analysis of X-ray computed microtomographic data. Fiber segment orientation distributions were extracted from volumetric X-ray microtomography data sets of hydroentangled nonwoven fabrics manufactured from parallel-laid, cross-laid, and air-laid webs. Spherical coordinates represented the orientation of individual fibers. Physical testing of the samples by means of zero-span tensile testing and z-directional tensile testing was employed to compare with the computed results.}
}The spatial relationship between different objects plays an important role in defining the context of scenes. Most previous 3D classification and retrieval methods take into account either the individual geometry of the objects or simple relationships between them such as the contacts or adjacencies. In this article we propose a new method for the classification and retrieval of 3D objects based on the Interaction Bisector Surface (IBS), a subset of the Voronoi diagram defined between objects. The IBS is a sophisticated representation that describes topological relationships such as whether an object is wrapped in, linked to, or tangled with others, as well as geometric relationships such as the distance between objects. We propose a hierarchical framework to index scenes by examining both the topological structure and the geometric attributes of the IBS. The topology-based indexing can compare spatial relations without being severely affected by local geometric details of the object. Geometric attributes can also be applied in comparing the precise way in which the objects are interacting with one another. Experimental results show that our method is effective at relationship classification and content-based relationship retrieval.
@article{wrro106156,
volume = {33},
number = {3},
month = {May},
author = {X Zhao and H Wang and T Komura},
note = {{\copyright} ACM, 2014. This is the author's version of the work. It is posted here by permission of ACM for your personal use. Not for redistribution. The definitive version was published in ACM Transactions on Graphics (TOG) , 33 (3), May 2014, http://doi.acm.org/10.1145/2574860. Uploaded in accordance with the publisher's self-archiving policy.},
title = {Indexing 3D scenes using the interaction bisector surface},
publisher = {ACM},
year = {2014},
journal = {ACM Transactions on Graphics (TOG)},
keywords = {Algorithms, Design, Experimentation, Theory; Spatial relationships, classification, context-based retrieval},
url = {https://eprints.whiterose.ac.uk/106156/},
abstract = {The spatial relationship between different objects plays an important role in defining the context of scenes. Most previous 3D classification and retrieval methods take into account either the individual geometry of the objects or simple relationships between them such as the contacts or adjacencies. In this article we propose a new method for the classification and retrieval of 3D objects based on the Interaction Bisector Surface (IBS), a subset of the Voronoi diagram defined between objects. The IBS is a sophisticated representation that describes topological relationships such as whether an object is wrapped in, linked to, or tangled with others, as well as geometric relationships such as the distance between objects. We propose a hierarchical framework to index scenes by examining both the topological structure and the geometric attributes of the IBS. The topology-based indexing can compare spatial relations without being severely affected by local geometric details of the object. Geometric attributes can also be applied in comparing the precise way in which the objects are interacting with one another. Experimental results show that our method is effective at relationship classification and content-based relationship retrieval.}
}This paper presents the fundamental mathematics to determine the minimum crack width detectable with a terrestrial laser scanner in unit-based masonry. Orthogonal offset, interval scan angle, crack orientation, and crack depth are the main parameters. The theoretical work is benchmarked against laboratory tests using 4 samples with predesigned crack widths of 1-7 mm scanned at orthogonal distances of 5.0-12.5 m and at angles of 0 -30. Results showed that absolute errors of crack width were mostly less than 1.37 mm when the orthogonal distance varied 5.0-7.5 m but significantly increased for greater distances. The orthogonal distance had a disproportionately negative effect compared to the scan angle.
@article{wrro79316,
volume = {62},
month = {March},
author = {DF Laefer and L Truong-Hong and H Carr and M Singh},
note = {(c) 2014, Elsevier. NOTICE: this is the author?s version of a work that was accepted for publication in NDT and E International. Changes resulting from the publishing process, such as peer review, editing, corrections, structural formatting, and other quality control mechanisms may not be reflected in this document. Changes may have been made to this work since it was submitted for publication. A definitive version was subsequently published in NDT and E International, 62, 2014, 10.1016/j.ndteint.2013.11.001
},
title = {Crack detection limits in unit based masonry with terrestrial laser scanning},
publisher = {Elsevier},
year = {2014},
journal = {NDT and E International},
pages = {66 -- 76},
keywords = {Terrestrial laser scanning; Point cloud data; Crack detection; Structural health monitoring; Condition assessment; Masonry},
url = {https://eprints.whiterose.ac.uk/79316/},
abstract = {This paper presents the fundamental mathematics to determine the minimum crack width detectable with a terrestrial laser scanner in unit-based masonry. Orthogonal offset, interval scan angle, crack orientation, and crack depth are the main parameters. The theoretical work is benchmarked against laboratory tests using 4 samples with predesigned crack widths of 1-7 mm scanned at orthogonal distances of 5.0-12.5 m and at angles of 0 -30. Results showed that absolute errors of crack width were mostly less than 1.37 mm when the orthogonal distance varied 5.0-7.5 m but significantly increased for greater distances. The orthogonal distance had a disproportionately negative effect compared to the scan angle.}
}As with individual fields, one approach to visualizing multifields is to analyze the field and identify features. While some work has been carried out in detecting features in multifields, any discussion of multifield analysis must also identify techniques from single fields that can be extended appropriately.
@incollection{wrro97576,
author = {H Carr},
series = {Mathematics and Visualization},
booktitle = {Scientific Visualization: Uncertainty, Multifield, Biomedical, and Scalable Visualization},
editor = {CD Hansen and M Chen and CR Johnson and AE Kaufman and H Hagen},
title = {Feature analysis in multifields},
address = {London},
publisher = {Springer-Verlag},
year = {2014},
journal = {Mathematics and Visualization},
pages = {197--204},
url = {https://eprints.whiterose.ac.uk/97576/},
abstract = {As with individual fields, one approach to visualizing multifields is to analyze the field and identify features. While some work has been carried out in detecting features in multifields, any discussion of multifield analysis must also identify techniques from single fields that can be extended appropriately.}
}Computational topology is of interest in visualization because it summarizes useful global properties of a dataset. The greatest need for such abstractions is in massive data, and to date most implementations have opted for low-level languages to obtain space and time-efficient implementations. Such code is complex, and is becoming even more so with the need to operate efficiently on a range of parallel hardware. Motivated by rapid advances in functional programming and compiler technology, this chapter investigates whether a shift in programming paradigm could reduce the complexity of the task. Focusing on contour tree generation as a case study, the chapter makes three contributions. First, it sets out the development of a concise functional implementation of the algorithm. Second, it shows that the sequential functional code can be tuned to match the performance of an imperative implementation, albeit at some cost in code clarity. Third, it outlines new possiblilities for parallelisation using functional tools, and notes similarities between functional abstractions and emerging ideas in extreme-scale visualization.
@incollection{wrro81914,
booktitle = {Topology-Based Methods in Visualization III},
editor = {P-T Bremer and I Hotz and V Pascucci and R Peikert},
title = {Computational topology via functional programming: a baseline analysis},
author = {DJ Duke and H Carr},
publisher = {Springer},
year = {2014},
pages = {73 -- 88},
url = {https://eprints.whiterose.ac.uk/81914/},
abstract = {Computational topology is of interest in visualization because it summarizes useful global properties of a dataset. The greatest need for such abstractions is in massive data, and to date most implementations have opted for low-level languages to obtain space and time-efficient implementations. Such code is complex, and is becoming even more so with the need to operate efficiently on a range of parallel hardware. Motivated by rapid advances in functional programming and compiler technology, this chapter investigates whether a shift in programming paradigm could reduce the complexity of the task. Focusing on contour tree generation as a case study, the chapter makes three contributions. First, it sets out the development of a concise functional implementation of the algorithm. Second, it shows that the sequential functional code can be tuned to match the performance of an imperative implementation, albeit at some cost in code clarity. Third, it outlines new possiblilities for parallelisation using functional tools, and notes similarities between functional abstractions and emerging ideas in extreme-scale visualization.}
}Multifield visualization covers a range of data types that can be visualized with many different techniques.We summarize both the data types and the categories of techniques, and lay out the reasoning for dividing this Part into chapters by technique rather than by data type. As we have seen in the previous chapter,multifield visualization covers a broad range of types of data. It is therefore possible to discuss multifield visualization according to these data types, with each type covered in a separate chapter. However, it is also possible to approach the question by considering the techniques to be applied, many of which can be applied to multiple types of multifield data. In this chapter, we therefore discuss bothways of analysingmultifield visualization techniques, and why we have chosen to proceed according to technique rather than type in the subsequent chapters.
@incollection{wrro97577,
author = {H Hauser and H Carr},
series = {Mathematics and Visualization},
booktitle = {Scientific Visualization: Uncertainty, Multifield, Biomedical, and Scalable Visualization},
editor = {CD Hansen and M Chen and CR Johnson and AE Kaufman and H Hagen},
title = {Categorization},
address = {London},
publisher = {Springer-Verlag},
year = {2014},
journal = {Mathematics and Visualization},
pages = {111--117},
url = {https://eprints.whiterose.ac.uk/97577/},
abstract = {Multifield visualization covers a range of data types that can be visualized with many different techniques.We summarize both the data types and the categories of techniques, and lay out the reasoning for dividing this Part into chapters by technique rather than by data type. As we have seen in the previous chapter,multifield visualization covers a broad range of types of data. It is therefore possible to discuss multifield visualization according to these data types, with each type covered in a separate chapter. However, it is also possible to approach the question by considering the techniques to be applied, many of which can be applied to multiple types of multifield data. In this chapter, we therefore discuss bothways of analysingmultifield visualization techniques, and why we have chosen to proceed according to technique rather than type in the subsequent chapters.}
}This study investigated the effects of six attributes, associated with simplicity or attractiveness, on route preference for three pedestrian journey types (everyday, leisure and tourist). Using stated choice preference experiments with computer generated scenes, participants were asked to choose one of a pair of routes showing either two levels of the same attribute (experiment 1) or different attributes (experiment 2). Contrary to predictions, vegetation was the most influential for both everyday and leisure journeys, and land use ranked much lower than expected in both cases. Turns ranked higher than decision points for everyday journeys as predicted, but the positions of both were lowered by initially unranked attributes. As anticipated, points of interest were most important for tourist trips, with the initially unranked attributes having less influence. This is the first time so many attributes have been compared directly, providing new information about the importance of the attributes for different journeys. {\copyright} 2014 Springer International Publishing.
@misc{wrro80900,
volume = {8684 L},
author = {S Cook and RA Ruddle},
note = {{\copyright} 2014, Springer Verlag. This is an author produced version of a paper published in Spatial Cognition IX: International Conference, Spatial Cognition 2014, Proceedings. Uploaded in accordance with the publisher's self-archiving policy.
The final publication is available at Springer via http://dx.doi.org/10.1007/978-3-319-11215-2\_14},
booktitle = { Spatial Cognition 2014},
editor = {C Freksa and B Nebel and M Hegarty and T Barkowsky},
title = {Effect of simplicity and attractiveness on route selection for different journey types},
publisher = {Springer Verlag},
year = {2014},
journal = {Spatial Cognition IX International Conference, Spatial Cognition 2014, Proceedings},
pages = {190 -- 205},
keywords = {Attractiveness; pedestrian navigation; simplicity; wayfinding},
url = {https://eprints.whiterose.ac.uk/80900/},
abstract = {This study investigated the effects of six attributes, associated with simplicity or attractiveness, on route preference for three pedestrian journey types (everyday, leisure and tourist). Using stated choice preference experiments with computer generated scenes, participants were asked to choose one of a pair of routes showing either two levels of the same attribute (experiment 1) or different attributes (experiment 2). Contrary to predictions, vegetation was the most influential for both everyday and leisure journeys, and land use ranked much lower than expected in both cases. Turns ranked higher than decision points for everyday journeys as predicted, but the positions of both were lowered by initially unranked attributes. As anticipated, points of interest were most important for tourist trips, with the initially unranked attributes having less influence. This is the first time so many attributes have been compared directly, providing new information about the importance of the attributes for different journeys. {\copyright} 2014 Springer International Publishing.}
}Non-exhaustive local search methods are fundamental tools in applied branches of computing such as operations research, and in other applications of optimisation. These problems have proven stubbornly resistant to attempts to nd generic meta-heuristic toolkits that are both expressive and computationally e cient for the large problem spaces involved. This paper complements recent work on functional abstractions for local search by examining three fundamental operations on the states that characterise allowable and/or intermediate solutions. We describe how three fundamental operations are related, and how these can be implemented e ectively as part of a functional local search library.
@misc{wrro77404,
volume = {8241},
month = {December},
author = {R Senington and DJ Duke},
booktitle = {24th International Symposium, IFL 2012},
editor = {R Hinze},
title = {Decomposing metaheuristic operations},
address = {Heidelberg},
publisher = {Springer},
year = {2013},
journal = {Implementation and Application of Functional Languages},
pages = {224 -- 239},
keywords = {search; optimization; stochastic; combinatorial},
url = {https://eprints.whiterose.ac.uk/77404/},
abstract = {Non-exhaustive local search methods are fundamental tools in applied branches of computing such as operations research, and in other applications of optimisation. These problems have proven stubbornly resistant to attempts to nd generic meta-heuristic toolkits that are both expressive and computationally e cient for the large problem spaces involved. This paper complements recent work on functional abstractions for local search by examining three fundamental operations on the states that characterise allowable and/or intermediate solutions. We describe how three fundamental operations are related, and how these can be implemented e ectively as part of a functional local search library.}
}How can the notion of topological structures for single scalar fields be extended to multifields? In this paper we propose a definition for such structures using the concepts of Pareto optimality and Pareto dominance. Given a set of piecewise-linear, scalar functions over a common simplical complex of any dimension, our method finds regions of "consensus" among single fields' critical points and their connectivity relations. We show that our concepts are useful to data analysis on real-world examples originating from fluid-flow simulations; in two cases where the consensus of multiple scalar vortex predictors is of interest and in another case where one predictor is studied under different simulation parameters. We also compare the properties of our approach with current alternatives.
@article{wrro79280,
volume = {32},
number = {3 Pt 3},
month = {June},
author = {L Huettenberger and C Heine and H Carr and G Scheuermann and C Garth},
title = {Towards multifield scalar topology based on pareto optimality},
publisher = {Wiley},
year = {2013},
journal = {Computer Graphics Forum},
pages = {341 -- 350},
keywords = {Computer graphics; computational geometry and object modeling; geometric algorithms, languages, and systems},
url = {https://eprints.whiterose.ac.uk/79280/},
abstract = {How can the notion of topological structures for single scalar fields be extended to multifields? In this paper we propose a definition for such structures using the concepts of Pareto optimality and Pareto dominance. Given a set of piecewise-linear, scalar functions over a common simplical complex of any dimension, our method finds regions of "consensus" among single fields' critical points and their connectivity relations. We show that our concepts are useful to data analysis on real-world examples originating from fluid-flow simulations; in two cases where the consensus of multiple scalar vortex predictors is of interest and in another case where one predictor is studied under different simulation parameters. We also compare the properties of our approach with current alternatives.}
}Physical locomotion provides internal (body-based) sensory information about the translational and rotational components of movement. This chapter starts by summarizing the characteristics of model-, small- and large-scale VE applications, and attributes of ecological validity that are important for the application of navigation research. The type of navigation participants performed, the scale and spatial extent of the environment, and the richness of the visual scene are used to provide a framework for a review of research into the effect of body-based information on navigation. The review resolves contradictions between previous studies' findings, identifies types of navigation interface that are suited to different applications, and highlights areas in which further research is needed. Applications that take place in small-scale environments, where maneuvering is the most demanding aspect of navigation, will benefit from full-walking interfaces. However, collision detection may not be needed because users avoid obstacles even when they are below eye-level. Applications that involve large-scale spaces (e.g., buildings or cities) just need to provide the translational component of body-based information, because it is only in unusual scenarios that the rotational component of body-based information produces any significant benefit. This opens up the opportunity of combining linear treadmill and walking-in-place interfaces with projection displays that provide a wide field of view.
@incollection{wrro86512,
month = {May},
author = {RA Ruddle},
booktitle = {Human Walking in Virtual Environments: Perception, Technology, and Applications},
editor = {F Steinicke and Y Visell and J Campos and A Lecuyer},
address = {New York},
title = {The effect of translational and rotational body-based information on navigation},
publisher = {Springer},
year = {2013},
pages = {99--112},
keywords = {Translational; Rotational; Body-based information; Navigation; Cognition; Spatial knowledge},
url = {https://eprints.whiterose.ac.uk/86512/},
abstract = {Physical locomotion provides internal (body-based) sensory information about the translational and rotational components of movement. This chapter starts by summarizing the characteristics of model-, small- and large-scale VE applications, and attributes of ecological validity that are important for the application of navigation research. The type of navigation participants performed, the scale and spatial extent of the environment, and the richness of the visual scene are used to provide a framework for a review of research into the effect of body-based information on navigation. The review resolves contradictions between previous studies' findings, identifies types of navigation interface that are suited to different applications, and highlights areas in which further research is needed. Applications that take place in small-scale environments, where maneuvering is the most demanding aspect of navigation, will benefit from full-walking interfaces. However, collision detection may not be needed because users avoid obstacles even when they are below eye-level. Applications that involve large-scale spaces (e.g., buildings or cities) just need to provide the translational component of body-based information, because it is only in unusual scenarios that the rotational component of body-based information produces any significant benefit. This opens up the opportunity of combining linear treadmill and walking-in-place interfaces with projection displays that provide a wide field of view.}
}This article provides longitudinal data for when participants learned to travel with a walking metaphor through virtual reality (VR) worlds, using interfaces that ranged from joystick-only, to linear and omnidirectional treadmills, and actual walking in VR. Three metrics were used: travel time, collisions (a measure of accuracy), and the speed profile. The time that participants required to reach asymptotic performance for traveling, and what that asymptote was, varied considerably between interfaces. In particular, when a world had tight turns (0.75 m corridors), participants who walked were more proficient than those who used a joystick to locomote and turned either physically or with a joystick, even after 10 minutes of training. The speed profile showed that this was caused by participants spending a notable percentage of the time stationary, irrespective of whether or not they frequently played computer games. The study shows how speed profiles can be used to help evaluate participants' proficiency with travel interfaces, highlights the need for training to be structured to addresses specific weaknesses in proficiency (e.g., start-stop movement), and for studies to measure and report that proficiency.
@article{wrro76922,
volume = {10},
number = {2},
month = {May},
author = {RA Ruddle and E Volkova and HH Buelthoff},
note = {{\copyright} ACM, 2013. This is the author's version of the work. It is posted here by permission of ACM for your personal use. Not for redistribution. The definitive version was published in , ACM Transactions on Applied Perception VOL 10, ISS 2, (May 2013) http://dx.doi.org/10.1145/2465780.2465785 },
title = {Learning to Walk in Virtual Reality},
publisher = {Association for computer machinery},
year = {2013},
journal = {ACM Transactions on Applied Perception},
keywords = {Experimentation; Human Factors; Performance; Virtual reality interfaces; navigation; travel; metrics},
url = {https://eprints.whiterose.ac.uk/76922/},
abstract = {This article provides longitudinal data for when participants learned to travel with a walking metaphor through virtual reality (VR) worlds, using interfaces that ranged from joystick-only, to linear and omnidirectional treadmills, and actual walking in VR. Three metrics were used: travel time, collisions (a measure of accuracy), and the speed profile. The time that participants required to reach asymptotic performance for traveling, and what that asymptote was, varied considerably between interfaces. In particular, when a world had tight turns (0.75 m corridors), participants who walked were more proficient than those who used a joystick to locomote and turned either physically or with a joystick, even after 10 minutes of training. The speed profile showed that this was caused by participants spending a notable percentage of the time stationary, irrespective of whether or not they frequently played computer games. The study shows how speed profiles can be used to help evaluate participants' proficiency with travel interfaces, highlights the need for training to be structured to addresses specific weaknesses in proficiency (e.g., start-stop movement), and for studies to measure and report that proficiency.}
}Many data sets are sampled on regular lattices in two, three or more dimensions, and recent work has shown that statistical properties of these data sets must take into account the continuity of the underlying physical phenomena. However, the effects of quantization on the statistics have not yet been accounted for. This paper therefore reconciles the previous papers to the underlying mathematical theory, develops a mathematical model of quantized statistics of continuous functions, and proves convergence of geometric approximations to continuous statistics for regular sampling lattices. In addition, the computational cost of various approaches is considered, and recommendations made about when to use each type of statistic.
@article{wrro79281,
volume = {19},
number = {2},
month = {February},
author = {B Duffy and HA Carr and T M{\"o}ller},
note = {(c) 2013 IEEE. Personal use of this material is permitted. Permission from IEEE must be obtained for all other users, including reprinting/ republishing this material for advertising or promotional purposes, creating new collective works for resale or redistribution to servers or lists, or reuse of any copyrighted components of this work in other works.},
title = {Integrating isosurface statistics and histograms},
publisher = {Institute of Electrical and Electronics Engineers (IEEE)},
year = {2013},
journal = {IEEE Transactions on Visualization and Computer Graphics},
pages = {263 -- 277 (14)},
keywords = {Frequency distribution; geometric statistics; histograms; integration},
url = {https://eprints.whiterose.ac.uk/79281/},
abstract = {Many data sets are sampled on regular lattices in two, three or more dimensions, and recent work has shown that statistical properties of these data sets must take into account the continuity of the underlying physical phenomena. However, the effects of quantization on the statistics have not yet been accounted for. This paper therefore reconciles the previous papers to the underlying mathematical theory, develops a mathematical model of quantized statistics of continuous functions, and proves convergence of geometric approximations to continuous statistics for regular sampling lattices. In addition, the computational cost of various approaches is considered, and recommendations made about when to use each type of statistic.}
}Aims: To create and evaluate a virtual reality (VR) microscope that is as efficient as the conventional microscope, seeking to support the introduction of digital slides into routine practice. Methods and results: A VR microscope was designed and implemented by combining ultra-high-resolution displays with VR technology, techniques for fast interaction, and high usability. It was evaluated using a mixed factorial experimental design with technology and task as within-participant variables and grade of histopathologist as a between-participant variable. Time to diagnosis was similar for the conventional and VR microscopes. However, there was a significant difference in the mean magnification used between the two technologies, with participants working at a higher level of magnification on the VR microscope. Conclusions: The results suggest that, with the right technology, efficient use of digital pathology for routine practice is a realistic possibility. Further work is required to explore what magnification is required on the VR microscope for histopathologists to identify diagnostic features, and the effect on this of the digital slide production process.
@article{wrro74853,
volume = {62},
number = {2},
month = {January},
author = {R Randell and RA Ruddle and C Mello-Thoms and RG Thomas and P Quirke and D Treanor},
note = {{\copyright} 2013, Blackwell Publishing. This is an author produced version of a paper published in Histopathology. Uploaded in accordance with the publisher's self-archiving policy.},
title = {Virtual reality microscope versus conventional microscope regarding time to diagnosis: an experimental study.},
publisher = {Wiley},
year = {2013},
journal = {Histopathology},
pages = {351--358},
url = {https://eprints.whiterose.ac.uk/74853/},
abstract = {Aims:  To create and evaluate a virtual reality (VR) microscope that is as efficient as the conventional microscope, seeking to support the introduction of digital slides into routine practice. Methods and results:  A VR microscope was designed and implemented by combining ultra-high-resolution displays with VR technology, techniques for fast interaction, and high usability. It was evaluated using a mixed factorial experimental design with technology and task as within-participant variables and grade of histopathologist as a between-participant variable. Time to diagnosis was similar for the conventional and VR microscopes. However, there was a significant difference in the mean magnification used between the two technologies, with participants working at a higher level of magnification on the VR microscope. Conclusions:  The results suggest that, with the right technology, efficient use of digital pathology for routine practice is a realistic possibility. Further work is required to explore what magnification is required on the VR microscope for histopathologists to identify diagnostic features, and the effect on this of the digital slide production process.}
}Contour trees and Reeb graphs are firmly embedded in scientific visualization for analysing univariate (scalar) fields. We generalize this analysis to multivariate fields with a data structure called the Joint Contour Net that quantizes the variation of multiple variables simultaneously. We report the first algorithm for constructing the Joint Contour Net and demonstrate that Contour Trees for individual variables can be extracted from the Joint Contour Net.
@misc{wrro79239,
booktitle = {2013 IEEE Pacific Visualization Symposium},
title = {Joint contour nets: computation and properties},
author = {H Carr and D Duke},
publisher = {IEEE},
year = {2013},
pages = {161 -- 168},
journal = {Visualization Symposium (PacificVis), 2013 IEEE Pacific},
keywords = {Computational topology; Contour analysis; contour tree; Joint Contour Net; Multivariate; Reeb graph; Reeb space},
url = {https://eprints.whiterose.ac.uk/79239/},
abstract = {Contour trees and Reeb graphs are firmly embedded in scientific visualization for analysing univariate (scalar) fields. We generalize this analysis to multivariate fields with a data structure called the Joint Contour Net that quantizes the variation of multiple variables simultaneously. We report the first algorithm for constructing the Joint Contour Net and demonstrate that Contour Trees for individual variables can be extracted from the Joint Contour Net.}
}Contour Trees and Reeb Graphs are firmly embedded in scientific visualisation for analysing univariate (scalar) fields. We generalize this analysis to multivariate fields with a data structure called the Joint Contour Net that quantizes the variation of multiple variables simultaneously. We report the first algorithm for constructing the Joint Contour Net, and demonstrate some of the properties that make it practically useful for visualisation, including accelerating computation by exploiting a relationship with rasterisation in the range of the function.
@article{wrro79282,
title = {Joint contour nets},
author = {DJ Duke and H Carr},
publisher = {Institute of Electrical and Electronics Engineers},
year = {2013},
note = {(c) 2013 IEEE. Personal use of this material is permitted. Permission from IEEE must be obtained for all other users, including reprinting/ republishing this material for advertising or promotional purposes, creating new collective works for resale or redistribution to servers or lists, or reuse of any copyrighted components of this work in other works.},
journal = {IEEE Transactions on Visualization and Computer Graphics},
keywords = {computational topology; contour tree; reeb graph; multivariate; contour analysis; reeb space; joint contour net},
url = {https://eprints.whiterose.ac.uk/79282/},
abstract = {Contour Trees and Reeb Graphs are firmly embedded in scientific visualisation for analysing univariate (scalar) fields. We generalize this analysis to multivariate fields with a data structure called the Joint Contour Net that quantizes the variation of multiple variables simultaneously. We report the first algorithm for constructing the Joint Contour Net, and demonstrate some of the properties that make it practically useful for visualisation, including accelerating computation by exploiting a relationship with rasterisation in the range of the function.}
}Traditional documentation capabilities of laser scanning technology can be further exploited for urban modeling through the transformation of resulting point clouds into solid models compatible for computational analysis. This article introduces such a technique through the combination of an angle criterion and voxelization. As part of that, a k-nearest neighbor (kNN) searching algorithm is implemented using a predefined number of kNN points combined with a maximum radius of the neighborhood, something not previously implemented. From this sample, points are categorized as boundary or interior points based on an angle criterion. Façade features are determined based on underlying vertical and horizontal grid voxels of the feature boundaries by a grid clustering technique. The complete building model involving all full voxels is generated by employing the Flying Voxel method to relabel voxels that are inside openings or outside the façade as empty voxels. Experimental results on three different buildings, using four distinct sampling densities showed successful detection of all openings, reconstruction of all building façades, and automatic filling of all improper holes. The maximum nodal displacement divergence was 1.6\% compared to manually generated meshes from measured drawings. This fully automated approach rivals processing times of other techniques with the distinct advantage of extracting more boundary points, especially in less dense data sets ({\ensuremath{<}}175 points/m2), which may enable its more rapid exploitation of aerial laser scanning data and ultimately preclude needing a priori knowledge.
@article{wrro79317,
volume = {28},
number = {2},
author = {L Truong-Hong and DF Laefer and T Hinks and H Carr},
note = {(c) 2013, Wiley. This is the accepted version of the following article: Truong-Hong, L, Laefer, DF, Hinks, T and Carr, H () Combining an angle criterion with voxelization and the flying voxel method in reconstructing building models from LiDAR data. Computer-Aided Civil and Infrastructure Engineering, 28 (2). 112 - 129. ISSN 1093-9687, which has been published in final form at http://dx.doi.org/10.1111/j.1467-8667.2012.00761.x},
title = {Combining an angle criterion with voxelization and the flying voxel method in reconstructing building models from LiDAR data},
publisher = {Wiley},
year = {2013},
journal = {Computer-Aided Civil and Infrastructure Engineering},
pages = {112 -- 129},
url = {https://eprints.whiterose.ac.uk/79317/},
abstract = {Traditional documentation capabilities of laser scanning technology can be further exploited for urban modeling through the transformation of resulting point clouds into solid models compatible for computational analysis. This article introduces such a technique through the combination of an angle criterion and voxelization. As part of that, a k-nearest neighbor (kNN) searching algorithm is implemented using a predefined number of kNN points combined with a maximum radius of the neighborhood, something not previously implemented. From this sample, points are categorized as boundary or interior points based on an angle criterion. Fa{\c c}ade features are determined based on underlying vertical and horizontal grid voxels of the feature boundaries by a grid clustering technique. The complete building model involving all full voxels is generated by employing the Flying Voxel method to relabel voxels that are inside openings or outside the fa{\c c}ade as empty voxels. Experimental results on three different buildings, using four distinct sampling densities showed successful detection of all openings, reconstruction of all building fa{\c c}ades, and automatic filling of all improper holes. The maximum nodal displacement divergence was 1.6\% compared to manually generated meshes from measured drawings. This fully automated approach rivals processing times of other techniques with the distinct advantage of extracting more boundary points, especially in less dense data sets ({\ensuremath{<}}175 points/m2), which may enable its more rapid exploitation of aerial laser scanning data and ultimately preclude needing a priori knowledge.}
}The scale of comparative genomics data frequently overwhelms current data visualization methods on conventional (desktop) displays. This paper describes two types of solution that take advantage of wall-sized high-resolution displays (WHirDs), which have orders of magnitude more display real estate (i.e., pixels) than desktop displays. The first allows users to view detailed graphics of copy number variation (CNV) that were output by existing software. A WHirD's resolution allowed a 10{$\times$} increase in the granularity of bioinformatics output that was feasible for users to visually analyze, and this revealed a pattern that had previously been smoothed out from the underlying data. The second involved interactive visualization software that was innovative because it uses a music score metaphor to lay out CNV data, overcomes a perceptual distortion caused by amplification/deletion thresholds, uses filtering to reduce graphical data overload, and is the first comparative genomics visualization software that is designed to leverage a WHirD's real estate. In a field evaluation, a clinical user discovered a fundamental error in the way their data had been processed, and established confidence in the software by using it to 'find' known genetic patterns in hepatitis C-driven hepatocellular cancer.
@misc{wrro79191,
author = {RA Ruddle and W Fateen and D Treanor and P Quirke and P Sondergeld},
note = {(c) 2013, IEEE. This is the publishers draft version of a paper published in Proceedings, 2013 IEEE Symposium on Biological Data Visualization (BioVis). Uploaded in accordance with the publisher's self-archiving policy
},
booktitle = {2013 IEEE Symposium on Biological Data Visualization (BioVis)},
title = {Leveraging wall-sized high-resolution displays for comparative genomics analyses of copy number variation},
publisher = {IEEE},
journal = {BioVis 2013 - IEEE Symposium on Biological Data Visualization 2013, Proceedings},
pages = {89 -- 96},
year = {2013},
keywords = {Copy number variation; comparative genomics; wall-sized high-resolution displays; visualization; user interface},
url = {https://eprints.whiterose.ac.uk/79191/},
abstract = {The scale of comparative genomics data frequently overwhelms current data visualization methods on conventional (desktop) displays. This paper describes two types of solution that take advantage of wall-sized high-resolution displays (WHirDs), which have orders of magnitude more display real estate (i.e., pixels) than desktop displays. The first allows users to view detailed graphics of copy number variation (CNV) that were output by existing software. A WHirD's resolution allowed a 10{$\times$} increase in the granularity of bioinformatics output that was feasible for users to visually analyze, and this revealed a pattern that had previously been smoothed out from the underlying data. The second involved interactive visualization software that was innovative because it uses a music score metaphor to lay out CNV data, overcomes a perceptual distortion caused by amplification/deletion thresholds, uses filtering to reduce graphical data overload, and is the first comparative genomics visualization software that is designed to leverage a WHirD's real estate. In a field evaluation, a clinical user discovered a fundamental error in the way their data had been processed, and established confidence in the software by using it to 'find' known genetic patterns in hepatitis C-driven hepatocellular cancer.}
}Profiling real-world Haskell programs is hard, as compiler optimizations make it tricky to establish causality between the source code and program behavior. In this paper we attack the root issue by performing a causality analysis of functional programs under optimization. We apply our findings to build a novel profiling infrastructure on top of the Glasgow Haskell Compiler, allowing for performance analysis even of aggressively optimized programs.
@misc{wrro77401,
volume = {48},
number = {12},
author = {PM Wortmann and DJ Duke},
note = {(c) 2013, Proc. ACM Symposium on Haskell. This is an author produced version of a paper published in Proc. ACM Symposium on Haskell. Uploaded in accordance with the publisher's self-archiving policy
},
booktitle = {ACM Haskell Symposium 2013},
title = {Causality of Optimized Haskell: What is burning our cycles?},
publisher = {ACM Press},
year = {2013},
journal = {Proc. ACM Symposium on Haskell},
pages = {141 -- 151},
keywords = {Profiling; Optimization; Haskell; Causality},
url = {https://eprints.whiterose.ac.uk/77401/},
abstract = {Profiling real-world Haskell programs is hard, as compiler optimizations make it tricky to establish causality between the source code and program behavior. In this paper we attack the root issue by performing a causality analysis of functional programs under optimization. We apply our findings to build a novel profiling infrastructure on top of the Glasgow Haskell Compiler, allowing for performance analysis even of aggressively optimized programs.}
}In nuclear science, density functional theory (DFT) is a powerful tool to model the complex interactions within the atomic nucleus, and is the primary theoretical approach used by physicists seeking a better understanding of fission. However DFT simulations result in complex multivariate datasets in which it is difficult to locate the crucial `scission' point at which one nucleus fragments into two, and to identify the precursors to scission. The Joint Contour Net (JCN) has recently been proposed as a new data structure for the topological analysis of multivariate scalar fields, analogous to the contour tree for univariate fields. This paper reports the analysis of DFT simulations using the JCN, the first application of the JCN technique to real data. It makes three contributions to visualization: (i) a set of practical methods for visualizing the JCN, (ii) new insight into the detection of nuclear scission, and (iii) an analysis of aesthetic criteria to drive further work on representing the JCN.
@article{wrro77400,
volume = {18},
number = {12},
month = {December},
author = {DJ Duke and H Carr and A Knoll and N Schunck and HA Nam and A Staszczak},
note = {(c) 2012, IEEE. This is an author produced version of a paper published in IEEE Transactions on Visualization and Computer Graphics. Uploaded with permission from the publisher.
},
title = {Visualizing nuclear scission through a multifield extension of topological analysis},
publisher = {Institute of Electrical and Electronics Engineers},
year = {2012},
journal = {IEEE Transactions on Visualization and Computer Graphics},
pages = {2033 -- 2040},
keywords = {topology; scalar fields; multifields},
url = {https://eprints.whiterose.ac.uk/77400/},
abstract = {In nuclear science, density functional theory (DFT) is a powerful tool to model the complex interactions within the atomic nucleus, and is the primary theoretical approach used by physicists seeking a better understanding of fission. However DFT simulations result in complex multivariate datasets in which it is difficult to locate the crucial `scission' point at which one nucleus fragments into two, and to identify the precursors to scission. The Joint Contour Net (JCN) has recently been proposed as a new data structure for the topological analysis of multivariate scalar fields, analogous to the contour tree for univariate fields. This paper reports the analysis of DFT simulations using the JCN, the first application of the JCN technique to real data. It makes three contributions to visualization: (i) a set of practical methods for visualizing the JCN, (ii) new insight into the detection of nuclear scission, and (iii) an analysis of aesthetic criteria to drive further work on representing the JCN.}
}Histopathologists diagnose cancer and other diseases by using a microscope to examine glass slides containing thin sections of human tissue. Technological advances mean that it is now possible to digitise the slides so that they can be viewed on a computer, promising a number of benefits in terms of both efficiency and safety. Despite this, uptake of digital microscopy for diagnostic work has been slow, and research suggests scepticism and uncertainty amongst histopathologists. In order to design a successful digital microscope, one which fits with the work practices of histopathologists and which they are happy to use within their daily work, we have undertaken a workplace study of a histopathology department. In this paper, we present the findings of that study and discuss the implications of these findings for the design of a digital microscope. The findings emphasise the way in which a diagnosis is built up as particular features on the glass slides are noticed and highlighted and the various information sources that are drawn on in the process of making a diagnosis.
@article{wrro75286,
volume = {14},
number = {4},
month = {November},
author = {R Randell and RA Ruddle and R Thomas and D Treanor},
note = {{\copyright} 2012, Springer Verlag. This is an author produced version of an article published in Cognition, Technology and Work. Uploaded in accordance with the publisher's self-archiving policy. The final publication is available at www.springerlink.com},
title = {Diagnosis at the microscope: A workplace study of histopathology},
publisher = {Springer Verlag},
year = {2012},
journal = {Cognition, Technology and Work},
pages = {319 -- 335 },
keywords = {Healthcare, Histopathology, Digital pathology, Workplace study},
url = {https://eprints.whiterose.ac.uk/75286/},
abstract = {Histopathologists diagnose cancer and other diseases by using a microscope to examine glass slides containing thin sections of human tissue. Technological advances mean that it is now possible to digitise the slides so that they can be viewed on a computer, promising a number of benefits in terms of both efficiency and safety. Despite this, uptake of digital microscopy for diagnostic work has been slow, and research suggests scepticism and uncertainty amongst histopathologists. In order to design a successful digital microscope, one which fits with the work practices of histopathologists and which they are happy to use within their daily work, we have undertaken a workplace study of a histopathology department. In this paper, we present the findings of that study and discuss the implications of these findings for the design of a digital microscope. The findings emphasise the way in which a diagnosis is built up as particular features on the glass slides are noticed and highlighted and the various information sources that are drawn on in the process of making a diagnosis.}
}Aims: To study the current work practice of histopathologists to inform the design of digital microscopy systems. Methods and results: Four gastrointestinal histopathologists were video-recorded as they undertook their routine work. Analysis of the video data shows a range of activities beyond viewing slides involved in reporting a case. There is much overlapping of activities, supported by the 'eyes free' nature of the pathologists' interaction with the microscope. The order and timing of activities varies according to consultant. Conclusions: In order to support the work of pathologists adequately, digital microscopy systems need to provide support for a range of activities beyond viewing slides. Digital microscopy systems should support multitasking, while also providing flexibility so that pathologists can adapt their use of the technology to their own working patterns.
@article{wrro74329,
volume = {60},
number = {3},
month = {February},
author = {R Randell and RA Ruddle and P Quirke and RG Thomas and D Treanor},
note = {{\copyright} 2012, Blackwell Publishing. This is an author produced version of a paper published in Histopathology. Uploaded in accordance with the publisher's self-archiving policy.
The definitive version is available at www.blackwell-synergy.com},
title = {Working at the microscope: analysis of the activities involved in diagnostic pathology},
publisher = {Blackwell publishing},
year = {2012},
journal = {Histopathology},
pages = {504 -- 510 },
url = {https://eprints.whiterose.ac.uk/74329/},
abstract = {Aims:  To study the current work practice of histopathologists to inform the design of digital microscopy systems. Methods and results:  Four gastrointestinal histopathologists were video-recorded as they undertook their routine work. Analysis of the video data shows a range of activities beyond viewing slides involved in reporting a case. There is much overlapping of activities, supported by the 'eyes free' nature of the pathologists' interaction with the microscope. The order and timing of activities varies according to consultant. Conclusions:  In order to support the work of pathologists adequately, digital microscopy systems need to provide support for a range of activities beyond viewing slides. Digital microscopy systems should support multitasking, while also providing flexibility so that pathologists can adapt their use of the technology to their own working patterns.}
}On the WWW users frequently revisit information they have previously seen, but "keeping found things found" is difficult when the information has not been visited frequently or recently, even if a user knows which website contained the information. This paper describes the design of a tool to help users refind information within a given website. The tool encodes data about a user's interest in webpages (measured by dwell time), the frequency and recency of visits, and navigational associations between pages, and presents navigation histories in list-and graph-based forms.
@article{wrro74330,
volume = {7224},
author = {TV Do and RA Ruddle},
note = {{\copyright} 2012,Springer. This is an author produced version of a paper published in Lecture notes in computer science. Uploaded in accordance with the publisher's self-archiving policy.
},
title = {The design of a visual history tool to help users refind information within a website},
publisher = {Springer},
journal = {Lecture Notes in Computer Science (including subseries Lecture Notes in Artificial Intelligence and Lecture Notes in Bioinformatics)},
pages = {459 -- 462 },
year = {2012},
url = {https://eprints.whiterose.ac.uk/74330/},
abstract = {On the WWW users frequently revisit information they have previously seen, but "keeping found things found" is difficult when the information has not been visited frequently or recently, even if a user knows which website contained the information. This paper describes the design of a tool to help users refind information within a given website. The tool encodes data about a user's interest in webpages (measured by dwell time), the frequency and recency of visits, and navigational associations between pages, and presents navigation histories in list-and graph-based forms.}
}Image analysis algorithms are often highly parameterized and much human input is needed to optimize parameter settings. This incurs a time cost of up to several days. We analyze and characterize the conventional parameter optimization process for image analysis and formulate user requirements. With this as input, we propose a change in paradigm by optimizing parameters based on parameter sampling and interactive visual exploration. To save time and reduce memory load, users are only involved in the first step–initialization of sampling–and the last step–visual analysis of output. This helps users to more thoroughly explore the parameter space and produce higher quality results. We describe a custom sampling plug-in we developed for CellProfiler–a popular biomedical image analysis framework. Our main focus is the development of an interactive visualization technique that enables users to analyze the relationships between sampled input parameters and corresponding output. We implemented this in a prototype called Paramorama. It provides users with a visual overview of parameters and their sampled values. User-defined areas of interest are presented in a structured way that includes image-based output and a novel layout algorithm. To find optimal parameter settings, users can tag high- and low-quality results to refine their search. We include two case studies to illustrate the utility of this approach.
@article{wrro74328,
volume = {17},
number = {12},
month = {December},
author = {AJ Pretorius and MA Bray and AE Carpenter and RA Ruddle},
note = {{\copyright} 2011, IEEE. This is an author produced version of a paper published in IEEE Transactions on Visualization and Computer Graphics. Uploaded in accordance with the publisher's self-archiving policy.
},
title = {Visualization of parameter space for image analysis},
publisher = {IEEE},
year = {2011},
journal = {IEEE Transactions on Visualization and Computer Graphics},
pages = {2402 -- 2411 },
keywords = {Algorithms, Androstadienes, Cell Line, Cell Nucleus, Chromones, Computer Graphics, Computer Simulation, Humans, Image Processing, Computer-Assisted, Morpholines, Software, User-Computer Interface},
url = {https://eprints.whiterose.ac.uk/74328/},
abstract = {Image analysis algorithms are often highly parameterized and much human input is needed to optimize parameter settings. This incurs a time cost of up to several days. We analyze and characterize the conventional parameter optimization process for image analysis and formulate user requirements. With this as input, we propose a change in paradigm by optimizing parameters based on parameter sampling and interactive visual exploration. To save time and reduce memory load, users are only involved in the first step--initialization of sampling--and the last step--visual analysis of output. This helps users to more thoroughly explore the parameter space and produce higher quality results. We describe a custom sampling plug-in we developed for CellProfiler--a popular biomedical image analysis framework. Our main focus is the development of an interactive visualization technique that enables users to analyze the relationships between sampled input parameters and corresponding output. We implemented this in a prototype called Paramorama. It provides users with a visual overview of parameters and their sampled values. User-defined areas of interest are presented in a structured way that includes image-based output and a novel layout algorithm. To find optimal parameter settings, users can tag high- and low-quality results to refine their search. We include two case studies to illustrate the utility of this approach.}
}In this paper, we show results of controlling a 3D articulated human body model by using a repulsive energy function. The idea is based on the energy-based unfolding and interpolation, which are guaranteed to produce intersection-free movements for closed 2D linkages. Here, we apply those approaches for articulated characters in 3D space. We present the results of two experiments. In the initial experiment, starting from a posture that the body limbs are tangled with each other, the body is controlled to unfold tangles and straighten the limbs by moving the body in the gradient direction of an energy function based on the distance between two arbitrary linkages. In the second experiment, two different postures of limbs being tangled are interpolated by guiding the body using the energy function. We show that intersection free movements can be synthesized even when starting from complex postures that the limbs are intertwined with each other. At the end of the paper, we discuss about the limitations of the method and future possibilities of this approach.
@misc{wrro105172,
volume = {7060},
month = {November},
author = {H Wang and T Komura},
booktitle = {4th International Workshop on Motion in Games (MIG 2011)},
editor = {JM Allbeck and P Faloutsos},
title = {Energy-Based Pose Unfolding and Interpolation for 3D Articulated Characters},
publisher = {Springer Verlag},
year = {2011},
journal = {Lecture Notes in Computer Science},
pages = {110--119},
keywords = {character animation; motion planning; pose interpolation},
url = {https://eprints.whiterose.ac.uk/105172/},
abstract = {In this paper, we show results of controlling a 3D articulated human body model by using a repulsive energy function. The idea is based on the energy-based unfolding and interpolation, which are guaranteed to produce intersection-free movements for closed 2D linkages. Here, we apply those approaches for articulated characters in 3D space. We present the results of two experiments. In the initial experiment, starting from a posture that the body limbs are tangled with each other, the body is controlled to unfold tangles and straighten the limbs by moving the body in the gradient direction of an energy function based on the distance between two arbitrary linkages. In the second experiment, two different postures of limbs being tangled are interpolated by guiding the body using the energy function. We show that intersection free movements can be synthesized even when starting from complex postures that the limbs are intertwined with each other. At the end of the paper, we discuss about the limitations of the method and future possibilities of this approach.}
}This study investigated the effect of body-based information (proprioception, etc.) when participants navigated large-scale virtual marketplaces that were either small (Experiment 1) or large in extent (Experiment 2). Extent refers to the size of an environment, whereas scale refers to whether people have to travel through an environment to see the detail necessary for navigation. Each participant was provided with full body-based information (walking through the virtual marketplaces in a large tracking hall or on an omnidirectional treadmill), just the translational component of body-based information (walking on a linear treadmill, but turning with a joystick), just the rotational component (physically turning but using a joystick to translate) or no body-based information (joysticks to translate and rotate). In large and small environments translational body-based information significantly improved the accuracy of participants' cognitive maps, measured using estimates of direction and relative straight line distance but, on its own, rotational body-based information had no effect. In environments of small extent, full body-based information also improved participants' navigational performance. The experiments show that locomotion devices such as linear treadmills would bring substantial benefits to virtual environment applications where large spaces are navigated, and theories of human navigation need to reconsider the contribution made by body-based information, and distinguish between environmental scale and extent.
@article{wrro74327,
volume = {18},
number = {2},
month = {June},
author = {RA Ruddle and E Volkova and HH Bulthoff},
note = {{\copyright} ACM, 2011. This is the author's version of the work. It is posted here by permission of ACM for your personal use. Not for redistribution. The definitive version was published in ACM Transactions on Computer - Human Interaction, VOL 18, ISS 2,(2011) http://doi.acm.org/10.1145/1970378.1970384},
title = {Walking improves your cognitive map in environments that are large-scale and large in extent},
publisher = {Association for Computing Machinery},
year = {2011},
journal = {ACM Transactions on Computer - Human Interaction},
keywords = {virtual reality, navigation, locomotion, cognitive map, virtual environments, path-integration, spatial knowledge, optic flow, locomotion, navigation, distance, real, landmarks, senses},
url = {https://eprints.whiterose.ac.uk/74327/},
abstract = {This study investigated the effect of body-based information (proprioception, etc.) when participants navigated large-scale virtual marketplaces that were either small (Experiment 1) or large in extent (Experiment 2). Extent refers to the size of an environment, whereas scale refers to whether people have to travel through an environment to see the detail necessary for navigation. Each participant was provided with full body-based information (walking through the virtual marketplaces in a large tracking hall or on an omnidirectional treadmill), just the translational component of body-based information (walking on a linear treadmill, but turning with a joystick), just the rotational component (physically turning but using a joystick to translate) or no body-based information (joysticks to translate and rotate). In large and small environments translational body-based information significantly improved the accuracy of participants' cognitive maps, measured using estimates of direction and relative straight line distance but, on its own, rotational body-based information had no effect. In environments of small extent, full body-based information also improved participants' navigational performance. The experiments show that locomotion devices such as linear treadmills would bring substantial benefits to virtual environment applications where large spaces are navigated, and theories of human navigation need to reconsider the contribution made by body-based information, and distinguish between environmental scale and extent.}
}Two experiments investigated the effects of landmarks and body-based information on route knowledge. Participants made four out-and-back journeys along a route, guided only on the first outward trip and with feedback every time an error was made. Experiment 1 used 3-D virtual environments (VEs) with a desktop monitor display, and participants were provided with no supplementary landmarks, only global landmarks, only local landmarks, or both global and local landmarks. Local landmarks significantly reduced the number of errors that participants made, but global landmarks did not. Experiment 2 used a head-mounted display; here, participants who physically walked through the VE (translational and rotational body-based information) made 36\% fewer errors than did participants who traveled by physically turning but changing position using a joystick. Overall, the experiments showed that participants were less sure of where to turn than which way, and journey direction interacted with sensory information to affect the number and types of errors participants made.
@article{wrro74325,
volume = {39},
number = {4},
month = {May},
author = {RA Ruddle and E Volkova and B Mohler and HH B{\"u}lthoff},
note = {{\copyright} 2011, Psychonomic Society. This is an author produced version of a paper published in Memory and Cognition. Uploaded in accordance with the publisher's self-archiving policy.
},
title = {The effect of landmark and body-based sensory information on route knowledge},
publisher = {Psychonomic Society},
year = {2011},
journal = {Memory and Cognition},
pages = {686 -- 699 },
keywords = {Adult, Cues, Female, Humans, Kinesthesis, Locomotion, Male, Mental Recall, Orientation, Pattern Recognition, Visual, Proprioception, Space Perception, User-Computer Interface, Young Adult},
url = {https://eprints.whiterose.ac.uk/74325/},
abstract = {Two experiments investigated the effects of landmarks and body-based information on route knowledge. Participants made four out-and-back journeys along a route, guided only on the first outward trip and with feedback every time an error was made. Experiment 1 used 3-D virtual environments (VEs) with a desktop monitor display, and participants were provided with no supplementary landmarks, only global landmarks, only local landmarks, or both global and local landmarks. Local landmarks significantly reduced the number of errors that participants made, but global landmarks did not. Experiment 2 used a head-mounted display; here, participants who physically walked through the VE (translational and rotational body-based information) made 36\% fewer errors than did participants who traveled by physically turning but changing position using a joystick. Overall, the experiments showed that participants were less sure of where to turn than which way, and journey direction interacted with sensory information to affect the number and types of errors participants made.}
}An important issue in the design of visualization systems is to allow flexibility in providing a range of interfaces to a single body of algorithmic software. In this paper we describe how the ADVISE architecture provides exactly this flexibility. The architecture is cleanly separated into three layers: user interface, web service middleware and visualization components. This gives us the flexibility to provide a range of different delivery options, but all making use of the same basic set of visualization components. These delivery options comprise a range of user interfaces (visual pipeline editor, tailored application, web page), coupled with installation choice between a stand-alone desktop application, or a distributed client-server application.
@misc{wrro77851,
volume = {1},
number = {1},
month = {May},
author = {JD Wood and J Seo and DJ Duke and JPR Walton and KW Brodlie},
note = {{\copyright} 2010, Elsevier. This is an author produced version of a paper published in Procedia Computer Science. Uploaded in accordance with the publisher's self-archiving policy.
NOTICE: this is the author?s version of a work that was accepted for publication in Procedia Computer Science. Changes resulting from the publishing process, such as peer review, editing, corrections, structural formatting, and other quality control mechanisms may not be reflected in this document. Changes may have been made to this work since it was submitted for publication. A definitive version was subsequently published in Procedia Computer Science , [1,1 (May 2010)] DOI 10.1016/j.procs.2010.04.193
},
booktitle = {International Conference on Computational Science},
title = {Flexible delivery of visualization software and services},
publisher = {Elsevier},
year = {2010},
journal = {Procedia Computer Science},
pages = {1713 -- 1720},
keywords = {visualization; Service oriented architecture},
url = {https://eprints.whiterose.ac.uk/77851/},
abstract = {An important issue in the design of visualization systems is to allow flexibility in providing a range of interfaces to a single body of algorithmic software. In this paper we describe how the ADVISE architecture provides exactly this flexibility. The architecture is cleanly separated into three layers: user interface, web service middleware and visualization components. This gives us the flexibility to provide a range of different delivery options, but all making use of the same basic set of visualization components. These delivery options comprise a range of user interfaces (visual pipeline editor, tailored application, web page), coupled with installation choice between a stand-alone desktop application, or a distributed client-server application.}
}Information spaces such the WWW are the most challenging type of space that many people navigate during everyday life. Unlike the real world, there are no effective maps of information spaces, so people are forced to rely on search engines which are only suited to some types of retrieval task. This paper describes a new method for creating maps of information spaces, called INSPIRE. The INSPIRE engine is a tree drawing algorithm that uses a city metaphor, comprised of streets and buildings, and generates maps entirely automatically from webcrawl data. A technical evaluation was carried out using data from 112 universities, which had up to 485,775 pages on their websites. Although they take longer to compute than radial layouts (e.g., the Bubble Tree), INSPIRE maps are much more compact. INSPIRE maps also have desirable aesthetic properties of being orthogonal, preserving symmetry between identical subtrees and being planar.
@article{wrro74324,
title = {INSPIRE: A new method of mapping information spaces},
author = {RA Ruddle},
publisher = {IEEE},
year = {2010},
pages = {273 -- 279 },
note = {{\copyright} 2010, IEEE. This is an author produced version of a paper published in Information Visualisation (IV), 2010 14th International Conference. Uploaded in accordance with the publisher's self-archiving policy.
Personal use of this material is permitted. Permission from IEEE must be obtained for all other users, including reprinting/ republishing this material for advertising or promotional purposes, creating new collective works for resale or redistribution to servers or lists, or reuse of any copyrighted components of this work in other works.
},
journal = {Proceedings of the International Conference on Information Visualisation},
url = {https://eprints.whiterose.ac.uk/74324/},
abstract = {Information spaces such the WWW are the most challenging type of space that many people navigate during everyday life. Unlike the real world, there are no effective maps of information spaces, so people are forced to rely on search engines which are only suited to some types of retrieval task. This paper describes a new method for creating maps of information spaces, called INSPIRE. The INSPIRE engine is a tree drawing algorithm that uses a city metaphor, comprised of streets and buildings, and generates maps entirely automatically from webcrawl data. A technical evaluation was carried out using data from 112 universities, which had up to 485,775 pages on their websites. Although they take longer to compute than radial layouts (e.g., the Bubble Tree), INSPIRE maps are much more compact. INSPIRE maps also have desirable aesthetic properties of being orthogonal, preserving symmetry between identical subtrees and being planar.}
}Virtual slides could replace the conventional microscope. However, it can take 60\% longer to make a diagnosis with a virtual slide, due to the small display size and inadequate user interface of current systems. The aim was to create and test a virtual reality (VR) microscope using a Powerwall (a high-resolution array of 28 computer screens) for viewing virtual slides more efficiently.
@article{wrro74323,
volume = {55},
number = {3},
month = {September},
author = {D Treanor and N Jordan-Owers and J Hodrien and J Wood and P Quirke and RA Ruddle},
note = {{\copyright} 2009, Blackwell Publishing. This is an author produced version of a paper : Treanor, D, Jordan-Owers, N, Hodrien, J, Wood, J, Quirke, P and Ruddle, RA (2009) Virtual reality Powerwall versus conventional microscope for viewing pathology slides: an experimental comparison. Histopathology, 55 (3). 294 - 300, which has been published in final form at: http://dx.doi.org/10.1111/j.1365-2559.2009.03389.x},
title = {Virtual reality Powerwall versus conventional microscope for viewing pathology slides: an experimental comparison},
publisher = {Wiley},
year = {2009},
journal = {Histopathology},
pages = {294--300},
keywords = {Carcinoma, Basal Cell; Carcinoma, Squamous Cell; Diagnosis, Differential; Diagnostic Techniques and Procedures; Equipment Design; Humans; Image Processing, Computer-Assisted; Lymph Nodes; Microscopy; Pathology, Surgical; Skin Neoplasms; Tissue Array Analysis; User-Computer Interface},
url = {https://eprints.whiterose.ac.uk/74323/},
abstract = {Virtual slides could replace the conventional microscope. However, it can take 60\% longer to make a diagnosis with a virtual slide, due to the small display size and inadequate user interface of current systems. The aim was to create and test a virtual reality (VR) microscope using a Powerwall (a high-resolution array of 28 computer screens) for viewing virtual slides more efficiently.}
}Mobile group dynamics (MGDs) assist synchronous working in collaborative virtual environments (CVEs), and virtual time (VT) extends the benefits to asynchronous working. The present paper describes the implementation of MGDs (teleporting, awareness and multiple views) and VT (the utterances of 23 previous users were embedded in a CVE as conversation tags), and their evaluation using an urban planning task. Compared with previous research using the same scenario, the new MGD techniques produced substantial increases in the amount that, and distance over which, participants communicated. With VT participants chose to listen to a quarter of the conversations of their predecessors while performing the task. The embedded VT conversations led to a reduction in the rate at which participants traveled around, but an increase in live communication that took place. Taken together, the studies show how CVE interfaces can be improved for synchronous and asynchronous collaborations, and highlight possibilities for future research.
@article{wrro8630,
volume = {33},
number = {2},
month = {April},
author = {T.J. Dodds and R.A. Ruddle},
note = {{\copyright} 2009 Elsevier Ltd. This is an author produced version of a paper published in Computers \& Graphics. Uploaded in accordance with the publisher's self-archiving policy.
},
title = {Using mobile group dynamics and virtual time to improve teamwork in large-scale collaborative virtual environments
},
publisher = {Elsevier Ltd},
year = {2009},
journal = {Computers \& Graphics},
pages = {130--138},
keywords = {Collaborative virtual environments, virtual reality, asynchronous collaboration, group dynamics},
url = {https://eprints.whiterose.ac.uk/8630/},
abstract = {Mobile group dynamics (MGDs) assist synchronous working in collaborative virtual environments (CVEs), and virtual time (VT) extends the benefits to asynchronous working. The present paper describes the implementation of MGDs (teleporting, awareness and multiple views) and VT (the utterances of 23 previous users were embedded in a CVE as conversation tags), and their evaluation using an urban planning task. Compared with previous research using the same scenario, the new MGD techniques produced substantial increases in the amount that, and distance over which, participants communicated. With VT participants chose to listen to a quarter of the conversations of their predecessors while performing the task. The embedded VT conversations led to a reduction in the rate at which participants traveled around, but an increase in live communication that took place. Taken together, the studies show how CVE interfaces can be improved for synchronous and asynchronous collaborations, and highlight possibilities for future research.
}
}Navigation is the most common interactive task performed in three-dimensional virtual environments (VEs), but it is also a task that users often find difficult. We investigated how body-based information about the translational and rotational components of movement helped participants to perform a navigational search task (finding targets hidden inside boxes in a room-sized space). When participants physically walked around the VE while viewing it on a head-mounted display (HMD), they then performed 90% of trials perfectly, comparable to participants who had performed an equivalent task in the real world during a previous study. By contrast, participants performed less than 50% of trials perfectly if they used a tethered HMD (move by physically turning but pressing a button to translate) or a desktop display (no body-based information). This is the most complex navigational task in which a real-world level of performance has been achieved in a VE. Behavioral data indicates that both translational and rotational body-based information are required to accurately update one's position during navigation, and participants who walked tended to avoid obstacles, even though collision detection was not implemented and feedback not provided. A walking interface would bring immediate benefits to a number of VE applications.
@article{wrro8632,
volume = {16},
number = {1},
month = {April},
author = {R.A. Ruddle and S. Lessels},
note = {{\copyright} 2009 Association for Computing Machinery. This is the author's version of the work. It is posted here by permission of ACM for your personal use. Not for redistribution. The definitive version was published in ACM Transactions on Computer-Human Interaction, 16 (1). 5:1-5:18.
},
title = {The benefits of using a walking interface to navigate virtual environments},
publisher = {Association for Computing Machinery},
year = {2009},
journal = {ACM Transactions on Computer-Human Interaction},
pages = {5:1--5:18},
keywords = {virtual reality, navigation, locomotion, visual fidelity},
url = {https://eprints.whiterose.ac.uk/8632/},
abstract = {Navigation is the most common interactive task performed in three-dimensional virtual environments (VEs), but it is also a task that users often find difficult. We investigated how body-based information about the translational and rotational components of movement helped participants to perform a navigational search task (finding targets hidden inside boxes in a room-sized space). When participants physically walked around the VE while viewing it on a head-mounted display (HMD), they then performed 90\% of trials perfectly, comparable to participants who had performed an equivalent task in the real world during a previous study. By contrast, participants performed less than 50\% of trials perfectly if they used a tethered HMD (move by physically turning but pressing a button to translate) or a desktop display (no body-based information). This is the most complex navigational task in which a real-world level of performance has been achieved in a VE. Behavioral data indicates that both translational and rotational body-based information are required to accurately update one's position during navigation, and participants who walked tended to avoid obstacles, even though collision detection was not implemented and feedback not provided. A walking interface would bring immediate benefits to a number of VE applications.
}
}In a lifetime, an ?average? person will visit approximately a million webpages. Sometimes a person finds they want to return to a given page at some future date but, having no recollection of where it was (URL, host, etc.) and so has to look for it again from scratch. This paper assesses how a person?s memory could be assisted by the presentation of a ?map? of their web browsing activity. Three map organisation approaches were investigated: (i) time-based, (ii) place-based, and (iii) topic-based. Time-based organisation is the least suitable, because the temporal specificity of human memory is generally poor. Place-based approaches lack scalability, and are not helped by the fact that there is little repetition in the paths a person follows between places. Topic-based organisation is more promising, with topics derived from both the web content that is accessed and the search queries that are executed, which provide snapshots into a person?s cognitive processes by explicitly capturing the terminology of ?what? they were looking for at that moment in time. In terms of presentation, a map that combines aspects of network connectivity with a space filling approach is likely to be most effective.
@inproceedings{wrro8631,
booktitle = {WebSci'09: Society On-Line},
month = {March},
title = {Finding information again using
an individual?s web history},
author = {R.A. Ruddle},
publisher = {Web Science Research Initiative},
year = {2009},
journal = {Proceedings of the WebSci '09},
keywords = {Navigation; Web history; Information retrieval},
url = {https://eprints.whiterose.ac.uk/8631/},
abstract = {In a lifetime, an ?average? person will visit approximately a million webpages. Sometimes a person finds they want to return to a given page at some future date but, having no recollection of where it was (URL, host, etc.) and so has to look for it again from scratch. This paper assesses how a person?s memory could be assisted by the presentation of a ?map? of their web browsing activity. Three map organisation approaches were investigated: (i) time-based, (ii) place-based, and (iii) topic-based. Time-based organisation is the least suitable, because the temporal specificity of human memory is generally poor. Place-based approaches lack scalability, and are not helped by the fact that there is little repetition in the paths a person follows between places. Topic-based organisation is more promising, with topics derived from both the web content that is accessed and the search queries that are executed, which provide snapshots into a person?s cognitive processes by explicitly capturing the terminology of ?what? they were looking for at that moment in time. In terms of presentation, a map that combines aspects of network connectivity with a space filling approach is likely to be most effective.}
}A new method for generating trails from a person?s movement through a virtual environment (VE) is described. The method is entirely automatic (no user input is needed), and uses string-matching to identify similar sequences of movement and derive the person?s primary trail. The method was evaluated in a virtual building, and generated trails that substantially reduced the distance participants traveled when they searched for target objects in the building 5-8 weeks after a set of familiarization sessions. Only a modest amount of data (typically five traversals of the building) was required to generate trails that were both effective and stable, and the method was not affected by the order in which objects were visited. The trail generation method models an environment as a graph and, therefore, may be applied to aiding navigation in the real world and information spaces, as well as VEs.
@article{wrro4953,
volume = {17},
number = {6},
month = {December},
author = {R.A. Ruddle},
note = {{\copyright} 2008 by the Massachusetts Institute of Technology. This is an author produced version of a paper published in Presence : Teleoperators and Virtual Environments. Uploaded in accordance with the publisher's self-archiving policy.},
title = {Generating trails automatically, to aid navigation when you revisit an environment},
address = {6},
publisher = {MIT Press},
year = {2008},
journal = {Presence : Teleoperators and Virtual Environments},
pages = {562--574},
url = {https://eprints.whiterose.ac.uk/4953/},
abstract = {A new method for generating trails from a person?s movement through a virtual environment (VE) is described. The method is entirely automatic (no user input is needed), and uses string-matching to identify similar sequences of movement and derive the person?s primary trail. The method was evaluated in a virtual building, and generated trails that substantially reduced the distance participants traveled when they searched for target objects in the building 5-8 weeks after a set of familiarization sessions. Only a modest amount of data (typically five traversals of the building) was required to generate trails that were both effective and stable, and the method was not affected by the order in which objects were visited. The trail generation method models an environment as a graph and, therefore, may be applied to aiding navigation in the real world and information spaces, as well as VEs.}
}Service-oriented architectures are increasingly being used as the architectural style for creating large distributed computer applications. This paper examines the provision of visualization as a service that can be made available to application designers in order to combine with other services. We develop a three-layer architecture: a client layer which provides the user interface; a stateful web service middleware layer which provides a published interface to the visualization system; and finally, a visualization component layer which provides the core functionality of visualization techniques. This separation of middleware from the visualization components is crucial: it allows us to exploit the strengths of web service technologies in providing standardized access to the system, and in maintaining state information throughout a session, but also gives us the freedom to build our visualization layer in an efficient and flexible way without the constraints of web service protocols. We describe the design of a visualization service based on this architecture, and illustrate one aspect of the work by re-visiting an early example of web-based visualization.
@misc{wrro5040,
month = {December},
author = {J. Wood and K.W. Brodlie and J. Seo and D.J. Duke and J. Walton},
note = {{\copyright} Copyright 2008 IEEE. Personal use of this material is permitted. However, permission to reprint/republish this material for advertising or promotional purposes or for creating new collective works for resale or redistribution to servers or lists, or to reuse any copyrighted component of this work in other works must be obtained from the IEEE. },
booktitle = {eScience 2008},
title = {A web services architecture for visualization},
publisher = {IEEE Computer Society Press},
year = {2008},
journal = {Proceedings of the IEEE Fourth International Conference on eScience, 2008.},
pages = {1--7},
url = {https://eprints.whiterose.ac.uk/5040/},
abstract = {Service-oriented architectures are increasingly being used as the architectural style for creating large distributed computer applications. This paper examines the provision of visualization as a service that can be made available to application designers in order to combine with other services. We develop a three-layer architecture: a client layer which provides the user interface; a stateful web service middleware layer which provides a published interface to the visualization system; and finally, a visualization component layer which provides the core functionality of visualization techniques. This separation of middleware from the visualization components is crucial: it allows us to exploit the strengths of web service technologies in providing standardized access to the system, and in maintaining state information throughout a session, but also gives us the freedom to build our visualization layer in an efficient and flexible way without the constraints of web service protocols. We describe the design of a visualization service based on this architecture, and illustrate one aspect of the work by re-visiting an early example of web-based visualization.
}
}Scientific visualization is the transformation of data into images. The pipeline model is a widely-used implementation strategy. This term refers not only to linear chains of processing stages, but more generally to demand-driven networks of components. Apparent parallels with functional programming are more than superficial: e.g. some pipelines support streams of data, and a limited form of lazy evaluation. Yet almost all visualization systems are implemented in imperative languages. We challenge this position. Using Haskell, we have reconstructed several fundamental visualization techniques, with encouraging results both in terms of novel insight and performance. In this paper we set the context for our modest rebellion, report some of our results, and reflect on the lessons that we have learned.
@article{wrro4998,
volume = {43},
number = {9},
month = {September},
author = {D.J. Duke and R. Borgo and C. Runciman and M. Wallace},
note = {International Conference on Functional Programming 08, Session 15.
Copyright {\copyright} 2008 by the Association for Computing Machinery, Inc. (ACM). },
title = {Experience report: visualizing data through functional pipelines},
publisher = {ACM Press},
year = {2008},
journal = {SIGPLAN Notices},
pages = {379--382},
url = {https://eprints.whiterose.ac.uk/4998/},
abstract = {Scientific visualization is the transformation of data into images. The pipeline model is a widely-used implementation strategy.
This term refers not only to linear chains of processing stages, but more generally to demand-driven networks of components. Apparent parallels with functional programming are more than superficial: e.g.
some pipelines support streams of data, and a limited form of lazy evaluation. Yet almost all visualization systems are implemented in imperative languages. We challenge this position. Using Haskell, we have reconstructed several fundamental visualization techniques, with encouraging results both in terms of novel insight and performance. In this paper we set the context for our modest rebellion, report some of our results, and reflect on the lessons that we have learned.
}
}We have developed techniques called Mobile Group Dynamics (MGDs), which help groups of people to work together while they travel around large-scale virtual environments. MGDs explicitly showed the groups that people had formed themselves into, and helped people move around together and communicate over extended distances. The techniques were evaluated in the context of an urban planning application, by providing one batch of participants with MGDs and another with an interface based on conventional collaborative virtual environments (CVEs). Participants with MGDs spent nearly twice as much time in close proximity (within 10m of their nearest neighbor), communicated seven times more than participants with a conventional interface, and exhibitedreal-world patterns of behavior such as staying together over an extended period of time and regrouping after periods of separation. The study has implications for CVE designers, because it shows how MGDs improves groupwork in CVEs.
@misc{wrro4948,
author = {T.J. Dodds and R.A. Ruddle},
note = {{\copyright} Copyright 2008 IEEE. Personal use of this material is permitted. However, permission to reprint/republish this material for advertising or promotional purposes or for creating new collective works for resale or redistribution to servers or lists, or to reuse any copyrighted component of this work in other works must be obtained from the IEEE. },
booktitle = {IEEE Virtual Reality 2008},
title = {Mobile group dynamics in large-scale collaborative virtual
environments},
publisher = {IEEE},
journal = {Proceedings of IEEE Virtual Reality},
pages = {59--66},
year = {2008},
keywords = {Collaborative interaction, experimental methods, distributed
VR, usability},
url = {https://eprints.whiterose.ac.uk/4948/},
abstract = {We have developed techniques called Mobile Group Dynamics
(MGDs), which help groups of people to work together while they travel around large-scale virtual environments. MGDs explicitly showed the groups that people had formed themselves into, and helped people move around together and communicate over extended distances. The techniques were evaluated in the context of an urban planning application, by providing one batch of participants with MGDs and another with an interface based on conventional collaborative virtual environments (CVEs). Participants with MGDs spent nearly twice as much time in close proximity (within 10m of their nearest neighbor), communicated seven times
more than participants with a conventional interface, and exhibitedreal-world patterns of behavior such as staying together over an extended period of time and regrouping after periods of separation.
The study has implications for CVE designers, because it shows how MGDs improves groupwork in CVEs.}
}Mobile Group Dynamics (MGDs) are a suite of techniques that help people work together in large-scale collaborative virtual environments (CVEs). The present paper describes the implementation and evaluation of three additional MGDs techniques (teleporting, awareness and multiple views) which, when combined, produced a 4 times increase in the amount that participants communicated in a CVE and also significantly increased the extent to which participants communicated over extended distances in the CVE. The MGDs were evaluated using an urban planning scenario using groups of either seven (teleporting + awareness) or eight (teleporting + awareness + multiple views) participants. The study has implications for CVE designers, because it provides quantitative and qualitative data about how teleporting, awareness and multiple views improve groupwork in CVEs. Categories and Subject Descriptors (according to ACM CCS): C.2.4 [Computer-Communication Networks]: Distributed Systems ? Distributed applications; H.1.2 [Models and Principles]: User/Machine Systems ? Human factors; Software psychology; H.5.1 [Information Interfaces and Presentation]: Multimedia Information Systems ? Artificial, augmented and virtual realities; H.5.3 [Information Interfaces and Presentation]: Group and Organization Interfaces ? Collaborative computing; Computer-supported cooperative work; Synchronous interaction; I.3.7[Computer Graphics]: Three Dimensional Graphics and Realism ? Virtual Reality
@misc{wrro4949,
author = {T.J. Dodds and R.A. Ruddle},
note = {Copyright {\copyright} 2008 by the Eurographics Association. This is an author produced version of the paper. The definitive version is available
at diglib.eg.org . Uploaded in accordance with the publisher's self-archiving policy.},
booktitle = {14th Eurographics Symposium on Virtual Environments},
editor = {B. Mohler and R. van Liere},
title = {Using teleporting, awareness and multiple views to improve
teamwork in collaborative virtual environments},
publisher = {Eurographics Association},
year = {2008},
journal = {Virtual Environments 2008},
pages = {81--88},
url = {https://eprints.whiterose.ac.uk/4949/},
abstract = {Mobile Group Dynamics (MGDs) are a suite of techniques that help people work together in large-scale collaborative virtual environments (CVEs). The present paper describes the implementation and evaluation of three additional MGDs techniques (teleporting, awareness and multiple views) which, when combined, produced a 4 times increase in the amount that participants communicated in a CVE and also significantly increased the extent to which participants communicated over extended distances in the CVE. The MGDs were evaluated using an urban planning scenario using groups of either seven (teleporting + awareness) or eight (teleporting + awareness + multiple views) participants. The study has implications for CVE designers, because it provides quantitative and qualitative data about how teleporting, awareness and multiple views improve groupwork in CVEs. Categories and Subject Descriptors (according to ACM CCS): C.2.4 [Computer-Communication Networks]: Distributed Systems ? Distributed applications; H.1.2 [Models and Principles]: User/Machine Systems ? Human
factors; Software psychology; H.5.1 [Information Interfaces and Presentation]: Multimedia Information Systems
? Artificial, augmented and virtual realities; H.5.3 [Information Interfaces and Presentation]: Group and Organization Interfaces ? Collaborative computing; Computer-supported cooperative work; Synchronous interaction; I.3.7[Computer Graphics]: Three Dimensional Graphics and Realism ? Virtual Reality}
}Physically large display walls can now be constructed using off-the-shelf computer hardware. The high resolution of these displays (e.g., 50 million pixels) means that a large quantity of data can be presented to users, so the displays are well suited to visualization applications. However, current methods of interacting with display walls are somewhat time consuming. We have analyzed how users solve real visualization problems using three desktop applications (XmdvTool, Iris Explorer and Arc View), and used a new taxonomy to classify users? actions and illustrate the deficiencies of current display wall interaction methods. Following this we designed a novel methodfor interacting with display walls, which aims to let users interact as quickly as when a visualization application is used on a desktop system. Informal feedback gathered from our working prototype shows that interaction is both fast and fluid.
@misc{wrro4950,
author = {C. Rooney and R.A. Ruddle},
note = {Copyright {\copyright} 2008 by the Eurographics Association. This is an author produced version of the paper. The definitive version is available at diglib.eg.org . Uploaded in accordance with the publisher's self-archiving policy.},
booktitle = {The 6th Theory and Practice of Computer Graphics Conference (TP.CG.08)},
editor = {I.S. Lim and W. Tang},
title = {A new method for interacting with multi-window
applications on large, high resolution displays},
publisher = {Eurographics},
year = {2008},
journal = {Theory and Practice of Computer Graphics. Proceedings.},
pages = {75--82},
url = {https://eprints.whiterose.ac.uk/4950/},
abstract = {Physically large display walls can now be constructed using off-the-shelf computer hardware. The high resolution
of these displays (e.g., 50 million pixels) means that a large quantity of data can be presented to users, so the
displays are well suited to visualization applications. However, current methods of interacting with display walls
are somewhat time consuming. We have analyzed how users solve real visualization problems using three desktop
applications (XmdvTool, Iris Explorer and Arc View), and used a new taxonomy to classify users? actions and
illustrate the deficiencies of current display wall interaction methods. Following this we designed a novel methodfor interacting with display walls, which aims to let users interact as quickly as when a visualization application is used on a desktop system. Informal feedback gathered from our working prototype shows that interaction is both fast and fluid.}
}Although the development of computational aesthetics has largely concentrated on 3D geometry and illustrative rendering, aesthetics are equally an important principle underlying 2D graphics and information visualization. A canonical example is Beck?s design of the London underground map, which not only produced an informative and practical artefact, but also established a design aesthetic that has been widely adopted in other applications. This paper contributes a novel hybrid view to the debate on aesthetics. It arises from a practical industrial problem, that of mapping the vast network of underground assets, and producing outputs that can be readily comprehended by a range of users, from back-office planning staff through to on-site excavation teams. This work describes the link between asset drawing aesthetics and tasks, and discusses methods developed to support the presentation of integrated asset data. It distinguishes a holistic approach to visual complexity, taking clutter as one component of aesthetics, from the graph-theoretic reductionist model needed to measure and remove clutter. We argue that ?de-cluttering? does not mean loss of information, but rather repackaging details to make them more accessible. In this respect, aesthetics have a fundamental role in implementing Schneiderman?s mantra of ?overview, zoom & filter, details-on-demand? for information visualization.
@misc{wrro9072,
author = {N. Boukhelifa and D.J. Duke},
booktitle = {International Symposium on Computational Aesthetics in Graphics, Visualization, and Imaging},
editor = {P. Brown and D.W. Cunningham and V. Interrante and J. McCormack},
title = {The Aesthetics of the Underworld},
publisher = {Eurographics},
journal = {Computational Aesthetics in Graphics, Visualization, and Imaging (2008)},
pages = {41--48},
year = {2008},
url = {https://eprints.whiterose.ac.uk/9072/},
abstract = {Although the development of computational aesthetics has largely concentrated on 3D geometry and illustrative
rendering, aesthetics are equally an important principle underlying 2D graphics and information visualization. A
canonical example is Beck?s design of the London underground map, which not only produced an informative and
practical artefact, but also established a design aesthetic that has been widely adopted in other applications. This
paper contributes a novel hybrid view to the debate on aesthetics. It arises from a practical industrial problem,
that of mapping the vast network of underground assets, and producing outputs that can be readily comprehended
by a range of users, from back-office planning staff through to on-site excavation teams.
This work describes the link between asset drawing aesthetics and tasks, and discusses methods developed to
support the presentation of integrated asset data. It distinguishes a holistic approach to visual complexity, taking
clutter as one component of aesthetics, from the graph-theoretic reductionist model needed to measure and remove
clutter. We argue that ?de-cluttering? does not mean loss of information, but rather repackaging details to make
them more accessible. In this respect, aesthetics have a fundamental role in implementing Schneiderman?s mantra
of ?overview, zoom \& filter, details-on-demand? for information visualization.}
}@techreport{wrro4878,
author = {A.R. Beck and B. Bennett and N. Boukhelifa and AG Cohn and D Duke and G. Fu and S. Hickinbotham and J.G. Stell},
note = {{\copyright} UK Water Industry Research Limited 2006},
title = {Minimising street works disruption : knowledge and data integration for utility assets: progress from the MTU and VISTA projects
},
type = {Research Report},
publisher = {UK Water Industry Research Limited},
institution = {ARRAY(0x556a92f49940)},
journal = {UKWIR},
year = {2007},
url = {https://eprints.whiterose.ac.uk/4878/}
}Three levels of virtual environment (VE) metric are proposed, based on: (1) users? task performance (time taken, distance traveled and number of errors made), (2) physical behavior (locomotion, looking around, and time and error classification), and (3) decision making (i.e., cognitive) rationale (think aloud, interview and questionnaire). Examples of the use of these metrics are drawn from a detailed review of research into VE wayfinding. A case study from research into the fidelity that is required for efficient VE wayfinding is presented, showing the unsuitability in some circumstances of common metrics of task performance such as time and distance, and the benefits to be gained by making fine-grained analyses of users? behavior. Taken as a whole, the article highlights the range of techniques that have been successfully used to evaluate wayfinding and explains in detail how some of these techniques may be applied.
@article{wrro4959,
volume = {15},
number = {6},
month = {December},
author = {S. Lessels and R.A. Ruddle},
note = {Copyright {\copyright} 2006 by the Massachusetts Institute of Technology. This is an author produced version of a paper published in Presence : Teleoperators and Virtual Environments. Uploaded in accordance with the publisher's self-archiving policy.},
title = {Three levels of metric for evaluating wayfinding},
publisher = {MIT Press},
year = {2006},
journal = {Presence: Teleoperators and Virtual Environments},
pages = {637--654},
url = {https://eprints.whiterose.ac.uk/4959/},
abstract = {Three levels of virtual environment (VE) metric are proposed, based on: (1) users? task performance (time taken, distance traveled and number of errors made), (2) physical behavior (locomotion, looking around, and time and error classification), and (3) decision making (i.e., cognitive) rationale (think aloud, interview and questionnaire). Examples of the use of these metrics are drawn from a detailed review of research into VE wayfinding. A case study from research into the fidelity that is required for efficient VE wayfinding is presented, showing the unsuitability in some circumstances of common metrics of task performance such as time and distance, and the benefits to be gained by making fine-grained analyses of users? behavior. Taken as a whole, the article highlights the range of techniques that have been successfully used to evaluate wayfinding and explains in detail how some of these techniques may be applied.}
}During navigation, humans combine visual information from their surroundings with body-based information from the translational and rotational components of movement. Theories of navigation focus on the role of visual and rotational body-based information, even though experimental evidence shows they are not sufficient for complex spatial tasks. To investigate the contribution of all three sources of information, we asked participants to search a computer generated ?virtual? room for targets. Participants were provided with either only visual information, or visual supplemented with body-based information for all movement (walk group) or rotational movement (rotate group). The walk group performed the task with near-perfect efficiency, irrespective of whether a rich or impoverished visual scene was provided. The visual-only and rotate groups were significantly less efficient, and frequently searched parts of the room at least twice. This suggests full physical movement plays a critical role in navigational search, but only moderate visual detail is required.
@article{wrro4958,
volume = {17},
number = {6},
month = {June},
author = {R.A. Ruddle and S. Lessels},
note = {{\copyright} 2006 American Psychological Society. This is an author produced version of a paper published in Psychological Science. Uploaded in accordance with the publisher's self-archiving policy.},
title = {For efficient navigational search, humans require full physical movement but not a rich visual scene},
publisher = {Blackwell Science},
year = {2006},
journal = {Psychological Science},
pages = {460--465},
url = {https://eprints.whiterose.ac.uk/4958/},
abstract = {During navigation, humans combine visual information from their surroundings with body-based information from the translational and rotational components of movement. Theories of navigation focus on the role of visual and rotational body-based information, even though experimental evidence shows they are not sufficient for complex spatial tasks. To investigate the contribution of all three sources of information, we asked participants to search a computer generated ?virtual? room for targets. Participants were provided with either only visual information, or visual supplemented with body-based information for all movement (walk group) or rotational movement (rotate group). The walk group performed the task with near-perfect efficiency, irrespective of whether a rich or impoverished visual scene was provided. The visual-only and rotate groups were significantly less efficient, and frequently searched parts of the room at least twice. This suggests full physical movement plays a critical role in navigational search, but only moderate visual detail is required.}
}A method of using string-matching to analyze hypertext navigation was developed, and evaluated using two weeks of website logfile data. The method is divided into phases that use: (i) exact string-matching to calculate subsequences of links that were repeated in different navigation sessions (common trails through the website), and then (ii) inexact matching to find other similar sessions (a community of users with a similar interest). The evaluation showed how subsequences could be used to understand the information pathways users chose to follow within a website, and that exact and inexact matching provided complementary ways of identifying information that may have been of interest to a whole community of users, but which was only found by a minority. This illustrates how string-matching could be used to improve the structure of hypertext collections.
@misc{wrro4957,
author = {R.A. Ruddle},
note = {Copyright {\copyright} 2006 by the Association for Computing
Machinery, Inc. (ACM). This is an author produced version of a paper published in Proceedings of the 17th ACM Conference on Hypertext and Hypermedia. Uploaded in accordance with the publisher's self-archiving policy.},
booktitle = {Seventeenth Conference on Hypertext and Hypermedia},
address = {New York, NY},
title = {Using string-matching to analyze hypertext navigation},
publisher = {ACM},
year = {2006},
journal = {Proceedings of the 17th ACM Conference on Hypertext and Hypermedia},
pages = {49--52},
keywords = {Navigation, String-matching, Analysis.},
url = {https://eprints.whiterose.ac.uk/4957/},
abstract = {A method of using string-matching to analyze hypertext navigation was developed, and evaluated using two weeks of website logfile data. The method is divided into phases that use: (i) exact string-matching to calculate subsequences of links that were repeated in different navigation sessions (common trails through the website), and then (ii) inexact matching to find other similar sessions (a community of users with a similar interest). The evaluation showed how subsequences could be used to understand the information pathways users chose to follow within a website, and that exact and inexact matching provided complementary ways of identifying information that may have been of interest to a whole community of users, but which was only found by a minority. This illustrates how string-matching could be used to improve the structure of hypertext collections.}
}Two experiments investigated participants? ability to search for targets in a cluttered small-scale space. The first experiment was conducted in the real world with two field of view conditions (full vs. restricted), and participants found the task trivial to perform in both. The second experiment used the same search task but was conducted in a desktop virtual environment (VE), and investigated two movement interfaces and two visual scene conditions. Participants restricted to forward only movement performed the search task quicker and more efficiently (visiting fewer targets) than those who used an interface that allowed more flexible movement (forward, backward, left, right, and diagonal). Also, participants using a high fidelity visual scene performed the task significantly quicker and more efficiently than those who used a low fidelity scene. The performance differences between all the conditions decreased with practice, but the performance of the best VE group approached that of the real-world participants. These results indicate the importance of using high fidelity scenes in VEs, and suggest that the use of a simple control system is sufficient for maintaining ones spatial orientation during searching.
@article{wrro4960,
volume = {14},
number = {5},
month = {October},
author = {S. Lessels and R.A. Ruddle},
note = {{\copyright} 2005 MIT Press. This is an author produced version of a paper published in Presence. Uploaded in accordance with the publisher's self archiving policy.},
title = {Movement around real and virtual cluttered environments},
publisher = {MIT Press},
year = {2005},
journal = {Presence : Teleoperators and Virtual Environments},
pages = {580--596},
url = {https://eprints.whiterose.ac.uk/4960/},
abstract = {Two experiments investigated participants? ability to search for targets in a cluttered small-scale space. The first experiment was conducted in the real world with two field of view conditions (full vs. restricted), and participants found the task trivial to perform in both. The second experiment used the same search task but was conducted in a desktop virtual environment (VE), and investigated two movement interfaces and two visual scene conditions. Participants restricted to forward only movement performed the search task quicker and more efficiently (visiting fewer targets) than those who used an interface that allowed more flexible movement (forward, backward, left, right, and diagonal). Also, participants using a high fidelity visual scene performed the task significantly quicker and more efficiently than those who used a low fidelity scene. The performance differences between all the conditions decreased with practice, but the performance of the best VE group approached that of the real-world participants. These results indicate the importance of using high fidelity scenes in VEs, and suggest that the use of a simple control system is sufficient for maintaining ones spatial orientation during searching.}
}Visualizers, like logicians, have long been concerned with meaning. Generalizing from MacEachren's overview of cartography, visualizers have to think about how people extract meaning from pictures (psychophysics), what people understand from a picture (cognition), how pictures are imbued with meaning (semiotics), and how in some cases that meaning arises within a social and/or cultural context. If we think of the communication acts carried out in the visualization process further levels of meaning are suggested. Visualization begins when someone has data that they wish to explore and interpret; the data are encoded as input to a visualization system, which may in its turn interact with other systems to produce a representation. This is communicated back to the user(s), who have to assess this against their goals and knowledge, possibly leading to further cycles of activity. Each phase of this process involves communication between two parties. For this to succeed, those parties must share a common language with an agreed meaning. We offer the following three steps, in increasing order of formality: terminology (jargon), taxonomy (vocabulary), and ontology. Our argument in this article is that it's time to begin synthesizing the fragments and views into a level 3 model, an ontology of visualization. We also address why this should happen, what is already in place, how such an ontology might be constructed, and why now.
@article{wrro682,
volume = {25},
number = {3},
month = {May},
author = {D.J. Duke and K.W. Brodlie and D.A. Duce and I. Herman},
note = {Copyright {\copyright} 2005 IEEE. Personal use of this material is permitted. However, permission to reprint/republish this material for advertising or promotional purposes or for creating new collective works for resale or redistribution to servers or lists, or to reuse any copyrighted component of this work in other works must be obtained from the IEEE. },
title = {Do you see what I mean? },
year = {2005},
journal = {IEEE Computer Graphics and Applications},
pages = {6--9},
url = {https://eprints.whiterose.ac.uk/682/},
abstract = {Visualizers, like logicians, have long been concerned with meaning. Generalizing from MacEachren's overview of cartography, visualizers have to think about how people extract meaning from pictures (psychophysics), what people understand from a picture (cognition), how pictures are imbued with meaning (semiotics), and how in some cases that meaning arises within a social and/or cultural context. If we think of the communication acts carried out in the visualization process further levels of meaning are suggested. Visualization begins when someone has data that they wish to explore and interpret; the data are encoded as input to a visualization system, which may in its turn interact with other systems to produce a representation. This is communicated back to the user(s), who have to assess this against their goals and knowledge, possibly leading to further cycles of activity. Each phase of this process involves communication between two parties. For this to succeed, those parties must share a common language with an agreed meaning. We offer the following three steps, in increasing order of formality: terminology (jargon), taxonomy (vocabulary), and ontology. Our argument in this article is that it's time to begin synthesizing the fragments and views into a level 3 model, an ontology of visualization. We also address why this should happen, what is already in place, how such an ontology might be constructed, and why now. }
}Trails are a little-researched type of aid that offers great potential benefits for navigation, especially in virtual environments (VEs). An experiment was performed in which participants repeatedly searched a virtual building for target objects assisted by: (1) a trail, (2) landmarks, (3) a trail and landmarks, or (4) neither. The trail was displayed as a white line that showed exactly where a participant had` previously traveled. The trail halved the distance that participants traveled during first-time searches, indicating the immediate benefit to users if even a crude form of trail were implemented in a variety of VE applications. However, the general clutter or ?pollution? produced by trails reduced the benefit during subsequent navigation and, in the later stages of these searches, caused participants to travel more than twice as far as they needed to, often accidentally bypassing targets even when a trail led directly to them. The proposed solution is to use gene alignment techniques to extract a participant?s primary trail from the overall, polluted trail, and graphically emphasize the primary trail to aid navigation.
@misc{wrro4961,
author = {R.A. Ruddle},
note = {{\copyright} Copyright 2005 IEEE. Personal use of this material is permitted. However, permission to reprint/republish this material for advertising or promotional purposes or for creating new collective works for resale or redistribution to servers or lists, or to reuse any copyrighted component of this work in other works must be obtained from the IEEE. },
booktitle = {IEEE VR, 2005},
editor = {B. Frohlich and S. Julier and H. Takemura},
title = {The effect of trails on first-time and subsequent navigation
in a virtual environment},
publisher = {IEEE},
year = {2005},
journal = {Conference Proceedings. IEEE Virtual Reality 2005},
pages = {115--122},
keywords = {Virtual Environment, Navigation, Navigation Aid,
Trail, Landmark},
url = {https://eprints.whiterose.ac.uk/4961/},
abstract = {Trails are a little-researched type of aid that offers great potential
benefits for navigation, especially in virtual environments (VEs).
An experiment was performed in which participants repeatedly
searched a virtual building for target objects assisted by: (1) a
trail, (2) landmarks, (3) a trail and landmarks, or (4) neither. The
trail was displayed as a white line that showed exactly where a
participant had` previously traveled. The trail halved the distance
that participants traveled during first-time searches, indicating the
immediate benefit to users if even a crude form of trail were
implemented in a variety of VE applications. However, the
general clutter or ?pollution? produced by trails reduced the
benefit during subsequent navigation and, in the later stages of
these searches, caused participants to travel more than twice as far
as they needed to, often accidentally bypassing targets even when
a trail led directly to them. The proposed solution is to use gene
alignment techniques to extract a participant?s primary trail from
the overall, polluted trail, and graphically emphasize the primary
trail to aid navigation.}
}The difficulties people frequently have navigating in virtual environments (VEs) are well known. Usually these difficulties are quantified in terms of performance (e.g., time taken or number of errors made in following a path), with these data used to compare navigation in VEs to equivalent real-world settings. However, an important cause of any performance differences is changes in people?s navigational behaviour. This paper reports a study that investigated the effect of visual scene fidelity and field of view (FOV) on participants? behaviour in a navigational search task, to help identify the thresholds of fidelity that are required for efficient VE navigation. With a wide FOV (144 degrees), participants spent significantly larger proportion of their time travelling through the VE, whereas participants who used a normal FOV (48 degrees) spent significantly longer standing in one place planning where to travel. Also, participants who used a wide FOV and a high fidelity scene came significantly closer to conducting the search "perfectly" (visiting each place once). In an earlier real-world study, participants completed 93\% of their searches perfectly and planned where to travel while they moved. Thus, navigating a high fidelity VE with a wide FOV increased the similarity between VE and real-world navigational behaviour, which has important implications for both VE design and understanding human navigation. Detailed analysis of the errors that participants made during their non-perfect searches highlighted a dramatic difference between the two FOVs. With a narrow FOV participants often travelled right past a target without it appearing on the display, whereas with the wide FOV targets that were displayed towards the sides of participants overall FOV were often not searched, indicating a problem with the demands made by such a wide FOV display on human visual attention.
@misc{wrro4962,
author = {S. Lessels and R.A. Ruddle},
note = {Copyright {\copyright} 2004 by the Eurographics Association. This is an author produced version of the paper. The definitive version is available at diglib.eg.org . Uploaded in accordance with the publisher's self-archiving policy. },
booktitle = {EGVE'04},
editor = {S. Coquillart and M. G{\"o}bel},
title = {Changes in navigational behaviour produced by a wide field of view and a high fidelity visual scene},
publisher = {Eurographics},
year = {2004},
journal = {Proceedings of the 10th Eurographics Symposium on Virtual Environments},
pages = {71--78},
url = {https://eprints.whiterose.ac.uk/4962/},
abstract = {The difficulties people frequently have navigating in virtual environments (VEs) are well known. Usually these
difficulties are quantified in terms of performance (e.g., time taken or number of errors made in following a path),
with these data used to compare navigation in VEs to equivalent real-world settings. However, an important cause
of any performance differences is changes in people?s navigational behaviour. This paper reports a study that
investigated the effect of visual scene fidelity and field of view (FOV) on participants? behaviour in a navigational
search task, to help identify the thresholds of fidelity that are required for efficient VE navigation. With a wide FOV
(144 degrees), participants spent significantly larger proportion of their time travelling through the VE, whereas
participants who used a normal FOV (48 degrees) spent significantly longer standing in one place planning where
to travel. Also, participants who used a wide FOV and a high fidelity scene came significantly closer to conducting
the search "perfectly" (visiting each place once). In an earlier real-world study, participants completed 93\% of
their searches perfectly and planned where to travel while they moved. Thus, navigating a high fidelity VE with
a wide FOV increased the similarity between VE and real-world navigational behaviour, which has important
implications for both VE design and understanding human navigation.
Detailed analysis of the errors that participants made during their non-perfect searches highlighted a dramatic
difference between the two FOVs. With a narrow FOV participants often travelled right past a target without it
appearing on the display, whereas with the wide FOV targets that were displayed towards the sides of participants
overall FOV were often not searched, indicating a problem with the demands made by such a wide FOV display
on human visual attention.}
}Three experiments investigated the effect of implementing low-level aspects of motor control for a collaborative carrying task within a VE interface, leaving participants free to devote their cognitive resources to the higher-level components of the task. In the task, participants collaborated with an autonomous virtual human in an immersive virtual environment (VE) to carry an object along a predefined path. In experiment 1, participants took up to three times longer to perform the task with a conventional VE interface, in which they had to explicitly coordinate their hand and body movements, than with an interface that controlled the low-level tasks of grasping and holding onto the virtual object. Experiments 2 and 3 extended the study to include the task of carrying an object along a path that contained obstacles to movement. By allowing participants' virtual arms to stretch slightly, the interface software was able to take over some aspects of obstacle avoidance (another low-level task), and this led to further significant reductions in the time that participants took to perform the carrying task. Improvements in performance also occurred when participants used a tethered viewpoint to control their movements because they could see their immediate surroundings in the VEs. This latter finding demonstrates the superiority of a tethered view perspective to a conventional, human'seye perspective for this type of task.
@article{wrro1422,
volume = {12},
number = {2},
month = {April},
author = {R.A. Ruddle and J.C.D. Savage and D.M. Jones},
note = {{\copyright} 2003 The Massachusetts Institute of Technology. Reproduced in accordance with the publisher's self-archiving policy.},
title = {Levels of control during a collaborative carrying task},
publisher = {MIT Press},
year = {2003},
journal = {Presence: Teleoperators \& Virtual Environments},
pages = {140--155},
url = {https://eprints.whiterose.ac.uk/1422/},
abstract = {Three experiments investigated the effect of implementing low-level aspects of motor control for a collaborative carrying task within a VE interface, leaving participants free to devote their cognitive resources to the higher-level components of the task. In the task, participants collaborated with an autonomous virtual human in an immersive virtual environment (VE) to carry an object along a predefined path. In experiment 1, participants took up to three times longer to perform the task with a conventional VE interface, in which they had to explicitly coordinate their hand and body movements, than with an interface that controlled the low-level tasks of grasping and holding onto the virtual object.
Experiments 2 and 3 extended the study to include the task of carrying an object along a path that contained obstacles to movement. By allowing participants' virtual arms to stretch slightly, the interface software was able to take over some aspects of obstacle avoidance (another low-level task), and this led to further significant reductions in the time that participants took to perform the carrying task. Improvements in performance also occurred when participants used a tethered viewpoint to control their movements because they could see their immediate surroundings in the VEs. This latter finding demonstrates the superiority of a tethered view perspective to a conventional, human'seye perspective for this type of task.}
}Cooperation between multiple users in a virtual environment (VE) can take place at one of three levels. These are defined as where users can perceive each other (Level 1), individually change the scene (Level 2), or simultaneously act on and manipulate the same object (Level 3). Despite representing the highest level of cooperation, multi-user object manipulation has rarely been studied. This paper describes a behavioral experiment in which the piano movers' problem (maneuvering a large object through a restricted space) was used to investigate object manipulation by pairs of participants in a VE. Participants' interactions with the object were integrated together either symmetrically or asymmetrically. The former only allowed the common component of participants' actions to take place, but the latter used the mean. Symmetric action integration was superior for sections of the task when both participants had to perform similar actions, but if participants had to move in different ways (e.g., one maneuvering themselves through a narrow opening while the other traveled down a wide corridor) then asymmetric integration was superior. With both forms of integration, the extent to which participants coordinated their actions was poor and this led to a substantial cooperation overhead (the reduction in performance caused by having to cooperate with another person).
@article{wrro4965,
volume = {9},
number = {4},
month = {December},
author = {D.M. Jones and R.A. Ruddle and J.C. Savage},
note = {{\copyright} 2002 ACM. This is an author produced version of a paper published in ACM Transactions on Computer-Human Interaction. Uploaded in accordance with the publisher's self-archiving policy.},
title = {Symmetric and asymmetric action integration
during cooperative object manipulation in virtual
environments},
publisher = {ACM},
year = {2002},
journal = {ACM Transactions on Computer-Human Interaction (TOCHI)},
pages = {285--308},
keywords = {Virtual environments, object manipulation, piano movers' problem, rules of interaction.},
url = {https://eprints.whiterose.ac.uk/4965/},
abstract = {Cooperation between multiple users in a virtual environment (VE) can take place at one of three levels. These
are defined as where users can perceive each other (Level 1), individually change the scene (Level 2), or
simultaneously act on and manipulate the same object (Level 3). Despite representing the highest level of
cooperation, multi-user object manipulation has rarely been studied. This paper describes a behavioral
experiment in which the piano movers' problem (maneuvering a large object through a restricted space) was
used to investigate object manipulation by pairs of participants in a VE. Participants' interactions with the object
were integrated together either symmetrically or asymmetrically. The former only allowed the common
component of participants' actions to take place, but the latter used the mean. Symmetric action integration was
superior for sections of the task when both participants had to perform similar actions, but if participants had to
move in different ways (e.g., one maneuvering themselves through a narrow opening while the other traveled
down a wide corridor) then asymmetric integration was superior. With both forms of integration, the extent to
which participants coordinated their actions was poor and this led to a substantial cooperation overhead (the
reduction in performance caused by having to cooperate with another person).}
}A set of rules is presented for the design of interfaces that allow virtual objects to be manipulated in 3D virtual environments (VEs). The rules differ from other interaction techniques because they focus on the problems of manipulating objects in cluttered spaces rather than open spaces. Two experiments are described that were used to evaluate the effect of different interaction rules on participants' performance when they performed a task known as "the piano mover's problem." This task involved participants in moving a virtual human through parts of a virtual building while simultaneously manipulating a large virtual object that was held in the virtual human's hands, resembling the simulation of manual materials handling in a VE for ergonomic design. Throughout, participants viewed the VE on a large monitor, using an "over-the-shoulder" perspective. In the most cluttered VEs, the time that participants took to complete the task varied by up to 76\% with different combinations of rules, thus indicating the need for flexible forms of interaction in such environments.
@article{wrro1423,
volume = {11},
number = {6},
month = {December},
author = {R.A. Ruddle and J.C.D. Savage and D.M. Jones},
note = {{\copyright} 2002 The Massachusetts Institute of Technology. Reproduced in accordance with the publisher's self-archiving policy.},
title = {Evaluating rules of interaction for object manipulation in cluttered virtual environments},
publisher = {MIT Press},
year = {2002},
journal = {Presence: Teleoperators \& Virtual Environments},
pages = {591--609},
url = {https://eprints.whiterose.ac.uk/1423/},
abstract = {A set of rules is presented for the design of interfaces that allow virtual objects to be manipulated in 3D virtual environments (VEs). The rules differ from other interaction techniques because they focus on the problems of manipulating objects in cluttered spaces rather than open spaces. Two experiments are described that were used to evaluate the effect of different interaction rules on participants' performance when they performed a task known as "the piano mover's problem." This task involved participants in moving a virtual human through parts of a virtual building while simultaneously manipulating a large virtual object that was held in the virtual human's hands, resembling the simulation of manual materials handling in a VE for ergonomic design. Throughout, participants viewed the VE on a large monitor, using an "over-the-shoulder" perspective. In the most cluttered VEs, the time that participants took to complete the task varied by up to 76\% with different combinations of rules, thus indicating the need for flexible forms of interaction in such environments.}
}Object manipulation in cluttered virtual environments (VEs) brings additional challenges to the design of interaction algorithms, when compared with open virtual spaces. As the complexity of the algorithms increases so does the flexibility with which users can interact, but this is at the expense of much greater difficulties in implementation for developers. Three rules that increase the realism and flexibility of interaction are outlined: collision response, order of control, and physical compatibility. The implementation of each is described, highlighting the substantial increase in algorithm complexity that arises. Data are reported from an experiment in which participants manipulated a bulky virtual object through parts of a virtual building (the piano movers? problem). These data illustrate the benefits to users that accrue from implementing flexible rules of interaction.
@misc{wrro4964,
author = {D.M. Jones and R.A. Ruddle and J.C. Savage},
note = {Copyright 2002 ACM. This is an author produced version of a paper published in Proceedings of the ACM Symposium on Virtual Reality Software and Technology. Uploaded in accordance with the publisher's self-archiving policy.},
booktitle = {VRST'02},
title = {Implementing flexible rules of interaction for
object manipulation in cluttered virtual environments},
publisher = {ACM},
journal = {Proceedings of the ACM Symposium on Virtual Reality Software and Technology},
pages = {89--96},
year = {2002},
keywords = {Virtual Environments, Object Manipulation, Rules of Interaction.},
url = {https://eprints.whiterose.ac.uk/4964/},
abstract = {
Object manipulation in cluttered virtual environments (VEs)
brings additional challenges to the design of interaction
algorithms, when compared with open virtual spaces. As the
complexity of the algorithms increases so does the flexibility with
which users can interact, but this is at the expense of much
greater difficulties in implementation for developers. Three rules
that increase the realism and flexibility of interaction are outlined:
collision response, order of control, and physical compatibility.
The implementation of each is described, highlighting the
substantial increase in algorithm complexity that arises. Data are
reported from an experiment in which participants manipulated a
bulky virtual object through parts of a virtual building (the piano
movers? problem). These data illustrate the benefits to users that
accrue from implementing flexible rules of interaction.}
}Cooperation between multiple users in a virtual environment (VE) can take place at one of three levels, but it is only at the highest level that users can simultaneously interact with the same object. This paper describes a study in a straightforward realworld task (maneuvering a large object through a restricted space)was used to investigate object manipulation by pairs of participants in a VE, and focuses on the verbal communication that took place. This communication was analyzed using both categorizing and conversation analysis techniques. Of particular note was the sheer volume of communication that took place. One third of this was instructions from one participant to another of the locomotion and manipulation movements that they should make. Another quarter was general communication that was not directly related to performance of the experimental task, and often involved explicit statements of participants? actions or requests for clarification about what was happening. Further research is required to determine the extent to which haptic and auditory feedback reduce the need for inter-participant communication in collaborative tasks.
@misc{wrro5420,
author = {R.A. Ruddle and J.C.D. Savage and D.M. Jones},
booktitle = {CVE'02},
address = {New York},
title = {Verbal communication during cooperative object manipulation
},
publisher = {ACM},
journal = {Collaborative Virtual Environments. Proceedings of the 4th International Conference on Collaborative Virtual Environments},
pages = {120--127},
year = {2002},
keywords = {Virtual Environments, Object Manipulation, Verbal
Communication, Piano Movers' Problem, Rules of Interaction.},
url = {https://eprints.whiterose.ac.uk/5420/},
abstract = {Cooperation between multiple users in a virtual environment
(VE) can take place at one of three levels, but it is only at the highest level that users can simultaneously interact with the same object. This paper describes a study in a straightforward realworld task (maneuvering a large object through a restricted space)was used to investigate object manipulation by pairs of participants in a VE, and focuses on the verbal communication that took place. This communication was analyzed using both categorizing and conversation analysis techniques. Of particular note was the sheer volume of communication that took place. One
third of this was instructions from one participant to another of the locomotion and manipulation movements that they should make. Another quarter was general communication that was not directly related to performance of the experimental task, and often involved explicit statements of participants? actions or requests for clarification about what was happening. Further research is required to determine the extent to which haptic and auditory feedback reduce the need for inter-participant communication in
collaborative tasks.}
}Data is presented from virtual environment (VE) navigation studies that used building- and chessboard-type layouts. Participants learned by repeated navigation, spending several hours in each environment. While some participants quickly learned to navigate efficiently, others remained almost totally disoriented. In the virtual buildings this disorientation was illustrated by mean direction estimate errors of approximately 90?, and in the chessboard VEs disorientation was highlighted by the large number of rooms that some participants visited. Part of the cause of disorientation, and generally slow spatial learning, lies in the difficulty participants had learning the paths they had followed through the VEs.
@incollection{wrro5422,
volume = {6},
month = {October},
author = {R.A. Ruddle},
note = {Uploaded in accordance with the publisher's self-archiving policy.},
booktitle = {Engineering Psychology and Cognitive Ergonomics - Volume Six : Industrial Ergonomics, HCI, and Applied Cognitive Psychology},
editor = {D. Harris},
title = {Navigation: am I really lost or virtually there?},
publisher = {Ashgate},
year = {2001},
journal = {Engineering psychology and cognitive ergonomics},
pages = {135--142},
url = {https://eprints.whiterose.ac.uk/5422/},
abstract = {Data is presented from virtual environment (VE) navigation studies that used building- and chessboard-type layouts. Participants learned by repeated navigation, spending several hours in each environment. While some participants quickly learned to navigate efficiently, others remained almost totally disoriented. In the virtual buildings this disorientation was illustrated by mean direction estimate errors of approximately 90?, and in the chessboard VEs disorientation was highlighted by the large number of rooms that some participants visited. Part of the cause of disorientation, and generally slow spatial learning, lies in the difficulty participants had learning the paths they had followed through the VEs.}
}Imagine walking around a cluttered room but then having little idea of where you have traveled. This frequently happens when people move around small virtual environments (VEs), searching for targets. In three experiments, participants searched small-scale VEs using different movement interfaces, collision response algorithms, and fields of view. Participants' searches were most efficient in terms of distance traveled, time taken, and path followed when the simplest form of movement (view direction) was used in conjunction with a response algorithm that guided ("slipped") them around obstacles when collisions occurred. Unexpectedly, and in both immersive and desktop VEs, participants often had great difficulty finding the targets, despite the fact that participants could see the whole VE if they stood in one place and turned around. Thus, the trivial real-world task used in the present study highlights a basic problem with current VE systems.
@article{wrro1425,
volume = {10},
number = {5},
month = {October},
author = {R.A. Ruddle and D.M. Jones},
note = {{\copyright} 2001 The Massachusetts Institute of Technology. Reproduced in accordance with the publisher's self-archiving policy.},
title = {Movement in cluttered virtual environments},
publisher = {MIT Press},
year = {2001},
journal = {Presence: Teleoperators \& Virtual Environments},
pages = {511--524},
url = {https://eprints.whiterose.ac.uk/1425/},
abstract = {Imagine walking around a cluttered room but then having little idea of where you have traveled. This frequently happens when people move around small virtual environments (VEs), searching for targets. In three experiments, participants searched small-scale VEs using different movement interfaces, collision response algorithms, and fields of view. Participants' searches were most efficient in terms of distance traveled, time taken, and path followed when the simplest form of movement (view direction) was used in conjunction with a response algorithm that guided ("slipped") them around obstacles when collisions occurred. Unexpectedly, and in both immersive and desktop VEs, participants often had great difficulty finding the targets, despite the fact that participants could see the whole VE if they stood in one place and turned around. Thus, the trivial real-world task used in the present study highlights a basic problem with current VE systems.}
}Hyperlinks introduce discontinuities of movement to 3-D virtual environments (VEs). Nine independent attributes of hyperlinks are defined and their likely effects on navigation in VEs are discussed. Four experiments are described in which participants repeatedly navigated VEs that were either conventional (i.e. obeyed the laws of Euclidean space), or contained hyperlinks. Participants learned spatial knowledge slowly in both types of environment, echoing the findings of previous studies that used conventional VEs. The detrimental effects on participants' spatial knowledge of using hyperlinks for movement were reduced when a time-delay was introduced, but participants still developed less accurate knowledge than they did in the conventional VEs. Visual continuity had a greater influence on participants' rate of learning than continuity of movement, and participants were able to exploit hyperlinks that connected together disparate regions of a VE to reduce travel time.
@article{wrro76425,
volume = {53},
number = {4},
month = {October},
author = {RA Ruddle and A Howes and SJ Payne and DM Jones},
note = {{\copyright} 2000, Elsevier. This is an author produced version of a paper published in International Journal of Human Computer Studies. Uploaded in accordance with the publisher's self-archiving policy.
},
title = {Effects of hyperlinks on navigation in virtual environments},
publisher = {Elsevier},
year = {2000},
journal = {International Journal of Human Computer Studies},
pages = {551 -- 581},
url = {https://eprints.whiterose.ac.uk/76425/},
abstract = {Hyperlinks introduce discontinuities of movement to 3-D virtual environments (VEs). Nine independent attributes of hyperlinks are defined and their likely effects on navigation in VEs are discussed. Four experiments are described in which participants repeatedly navigated VEs that were either conventional (i.e. obeyed the laws of Euclidean space), or contained hyperlinks. Participants learned spatial knowledge slowly in both types of environment, echoing the findings of previous studies that used conventional VEs. The detrimental effects on participants' spatial knowledge of using hyperlinks for movement were reduced when a time-delay was introduced, but participants still developed less accurate knowledge than they did in the conventional VEs. Visual continuity had a greater influence on participants' rate of learning than continuity of movement, and participants were able to exploit hyperlinks that connected together disparate regions of a VE to reduce travel time.}
}Participants used a helmet-mounted display (HMD) and a desk-top (monitor) display to learn the layouts of two large-scale virtual environments (VEs) through repeated, direct navigational experience. Both VEs were "virtual buildings" containing more than seventy rooms. Participants using the HMD navigated the buildings significantly more quickly and developed a significantly more accurate sense of relative straight-line distance. There was no significant difference between the two types of display in terms of the distance that participants traveled or the mean accuracy of their direction estimates. Behavioral analyses showed that participants took advantage of the natural, head-tracked interface provided by the HMD in ways that included "looking around" more often while traveling through the VEs, and spending less time stationary in the VEs while choosing a direction in which to travel.
@article{wrro76426,
volume = {8},
number = {2},
month = {April},
author = {RA Ruddle and SJ Payne and DM Jones},
note = {{\copyright} 1999, Massachusetts Institute of Technology Press. Reproduced in accordance with the publisher's self-archiving policy.},
title = {Navigating large-scale virtual environments: What differences occur between helmet-mounted and desk-top displays?},
publisher = {Massachusetts Institute of Technology Press},
year = {1999},
journal = {Presence: Teleoperators and Virtual Environments},
pages = {157 -- 168},
url = {https://eprints.whiterose.ac.uk/76426/},
abstract = {Participants used a helmet-mounted display (HMD) and a desk-top (monitor) display to learn the layouts of two large-scale virtual environments (VEs) through repeated, direct navigational experience. Both VEs were "virtual buildings" containing more than seventy rooms. Participants using the HMD navigated the buildings significantly more quickly and developed a significantly more accurate sense of relative straight-line distance. There was no significant difference between the two types of display in terms of the distance that participants traveled or the mean accuracy of their direction estimates. Behavioral analyses showed that participants took advantage of the natural, head-tracked interface provided by the HMD in ways that included "looking around" more often while traveling through the VEs, and spending less time stationary in the VEs while choosing a direction in which to travel.}
}Participants used maps and other navigational aids to search desktop (nonimmersive) virtual environments (VEs) for objects that were small and not visible on a global map that showed the whole of a VE and its major topological features. Overall, participants searched most efficiently when they simultaneously used both the global map and a local map that showed their immediate surroundings and the objects' positions. However, after repeated searching, the global map on its own became equally effective. When participants used the local map on its own, their spatial knowledge developed in a manner that was previously associated with learning from a within-environment perspective rather than a survey perspective. Implications for the use of maps as aids for VE navigation are discussed.
@article{wrro76427,
volume = {5},
number = {1},
month = {March},
author = {RA Ruddle and SJ Payne and DM Jones},
note = {{\copyright} 1999, American Psychological Association. This is an author produced version of a paper published in Journal of Experimental Psychology: Applied. Uploaded in accordance with the publisher's self-archiving policy. This article may not exactly replicate the final version published in the APA journal. It is not the copy of record.
},
title = {The effects of maps on navigation and search strategies in very-large-scale virtual environments},
publisher = {American Psychological Association},
year = {1999},
journal = {Journal of Experimental Psychology: Applied},
pages = {54 -- 75},
url = {https://eprints.whiterose.ac.uk/76427/},
abstract = {Participants used maps and other navigational aids to search desktop (nonimmersive) virtual environments (VEs) for objects that were small and not visible on a global map that showed the whole of a VE and its major topological features. Overall, participants searched most efficiently when they simultaneously used both the global map and a local map that showed their immediate surroundings and the objects' positions. However, after repeated searching, the global map on its own became equally effective. When participants used the local map on its own, their spatial knowledge developed in a manner that was previously associated with learning from a within-environment perspective rather than a survey perspective. Implications for the use of maps as aids for VE navigation are discussed.}
}Participants used a helmet-mounted display (HMD) and a desk-top (monitor) display to learn the layouts of two large-scale virtual environments (VEs) through repeated, direct navigational experience. Both VEs were ??virtual buildings?? containing more than seventy rooms. Participants using the HMD navigated the buildings significantly more quickly and developed a significantly more accurate sense of relative straight-line distance. There was no significant difference between the two types of display in terms of the distance that participants traveled or the mean accuracy of their direction estimates. Behavioral analyses showed that participants took advantage of the natural, head-tracked interface provided by the HMD in ways that included ??looking around??more often while traveling through the VEs, and spending less time stationary in the VEs while choosing a direction in which to travel.
@article{wrro5428,
volume = {8},
number = {2},
author = {R.A. Ruddle and S.J. Payne and D.M. Jones},
note = {{\copyright} 1999 Massachusetts Institute of Technology. Reproduced in accordance with the publisher's self-archiving policy.
},
title = {Navigating large-scale virtual environments: what differences occur between helmet-mounted and desk-top displays?},
publisher = {Massachusetts Institute of Technology Press},
year = {1999},
journal = {Presence : Teleoperators and Virtual Environments},
pages = {157--168},
url = {https://eprints.whiterose.ac.uk/5428/},
abstract = {Participants used a helmet-mounted display (HMD) and a desk-top (monitor) display to learn the layouts of two large-scale virtual environments (VEs) through repeated, direct navigational experience. Both VEs were ??virtual buildings?? containing more than seventy rooms. Participants using the HMD navigated the buildings significantly more quickly and developed a significantly more accurate sense of relative straight-line distance.
There was no significant difference between the two types of display in terms of the distance that participants traveled or the mean accuracy of their direction estimates.
Behavioral analyses showed that participants took advantage of the natural, head-tracked interface provided by the HMD in ways that included ??looking around??more often while traveling through the VEs, and spending less time stationary in the VEs while choosing a direction in which to travel.
}
}Two experiments investigated components of participants? spatial knowledge when they navigated large-scale ??virtual buildings?? using ??desk-top?? (i.e., nonimmersive) virtual environments (VEs). Experiment 1 showed that participants could estimate directions with reasonable accuracy when they traveled along paths that contained one or two turns (changes of direction), but participants? estimates were significantly less accurate when the paths contained three turns. In Experiment 2 participants repeatedly navigated two more complex virtual buildings, one with and the other without a compass. The accuracy of participants? route-finding and their direction and relative straight-line distance estimates improved with experience, but there were no significant differences between the two compass conditions. However, participants did develop significantly more accurate spatial knowledge as they became more familiar with navigating VEs in general.
@article{wrro5424,
volume = {7},
number = {2},
month = {April},
author = {R.A. Ruddle and S.J. Payne and D.M. Jones},
note = {{\copyright} 1998 Massachusetts Institute of Technology. Reproduced in accordance with the publisher's self-archiving policy.},
title = {Navigating large-scale ??desk-top?? virtual buildings:
effects of orientation aids and familiarity},
publisher = {Massachusetts Institute of Technology Press},
year = {1998},
journal = {Presence: Teleoperators and Virtual Environments},
pages = {179--192},
url = {https://eprints.whiterose.ac.uk/5424/},
abstract = {Two experiments investigated components of participants? spatial knowledge when they navigated large-scale ??virtual buildings?? using ??desk-top?? (i.e., nonimmersive) virtual
environments (VEs). Experiment 1 showed that participants could estimate directions with reasonable accuracy when they traveled along paths that contained one or two turns (changes of direction), but participants? estimates were significantly less accurate when the paths contained three turns. In Experiment 2 participants repeatedly navigated two more complex virtual buildings, one with and the other without a compass. The accuracy of participants? route-finding and their direction and relative straight-line distance estimates improved with experience, but there were no significant differences between the two compass conditions. However, participants did develop significantly more accurate spatial knowledge as they became more familiar with navigating VEs in general.}
}Two experiments investigated components of participants' spatial knowledge when they navigated large-scale "virtual buildings" using "desk-top" (i.e., nonimmersive) virtual environments (VEs). Experiment 1 showed that participants could estimate directions with reasonable accuracy when they traveled along paths that contained one or two turns (changes of direction), but participants' estimates were significantly less accurate when the paths contained three turns. In Experiment 2 participants repeatedly navigated two more complex virtual buildings, one with and the other without a compass. The accuracy of participants' route-finding and their direction and relative straight-line distance estimates improved with experience, but there were no significant differences between the two compass conditions. However, participants did develop significantly more accurate spatial knowledge as they became more familiar with navigating VEs in general.
@article{wrro76428,
volume = {7},
number = {2},
month = {April},
author = {RA Ruddle and SJ Payne and DM Jones},
note = {{\copyright} 1998, Massachusetts Institute of Technology Press. Reproduced in accordance with the publisher's self-archiving policy. },
title = {Navigating large-scale "desk-top" virtual buildings: Effects of orientation aids and familiarity},
publisher = {Massachusetts Institute of Technology Press},
year = {1998},
journal = {Presence: Teleoperators and Virtual Environments},
pages = {179 -- 192},
url = {https://eprints.whiterose.ac.uk/76428/},
abstract = {Two experiments investigated components of participants' spatial knowledge when they navigated large-scale "virtual buildings" using "desk-top" (i.e., nonimmersive) virtual environments (VEs). Experiment 1 showed that participants could estimate directions with reasonable accuracy when they traveled along paths that contained one or two turns (changes of direction), but participants' estimates were significantly less accurate when the paths contained three turns. In Experiment 2 participants repeatedly navigated two more complex virtual buildings, one with and the other without a compass. The accuracy of participants' route-finding and their direction and relative straight-line distance estimates improved with experience, but there were no significant differences between the two compass conditions. However, participants did develop significantly more accurate spatial knowledge as they became more familiar with navigating VEs in general.}
}