Scalar Topological Visualisation
Hamish Carr
Scalar Topological Visualization
Once the contour tree has been computed, it can be used as the basis for user interfaces for scalar fields (most typically in 3D).
This is effective because branches in the tree correspond to features in the data, an observation that is crucial for visualization.

If you would like to play with this, the code can be found here
Of course, this involved solving secondary problems, such as simplification of the contour tree (IEEE Visualization 2019 Test of Time Award):
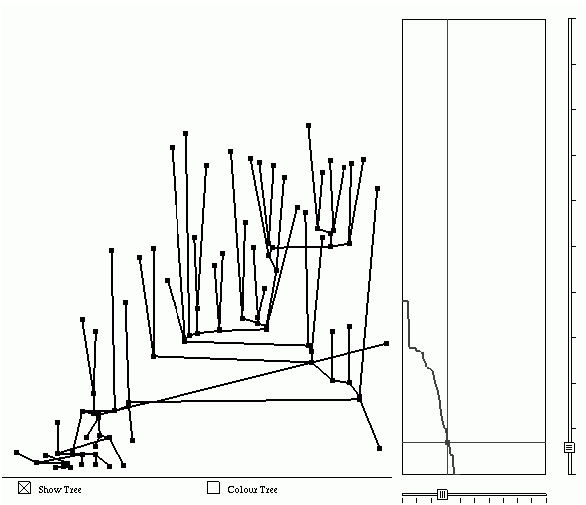
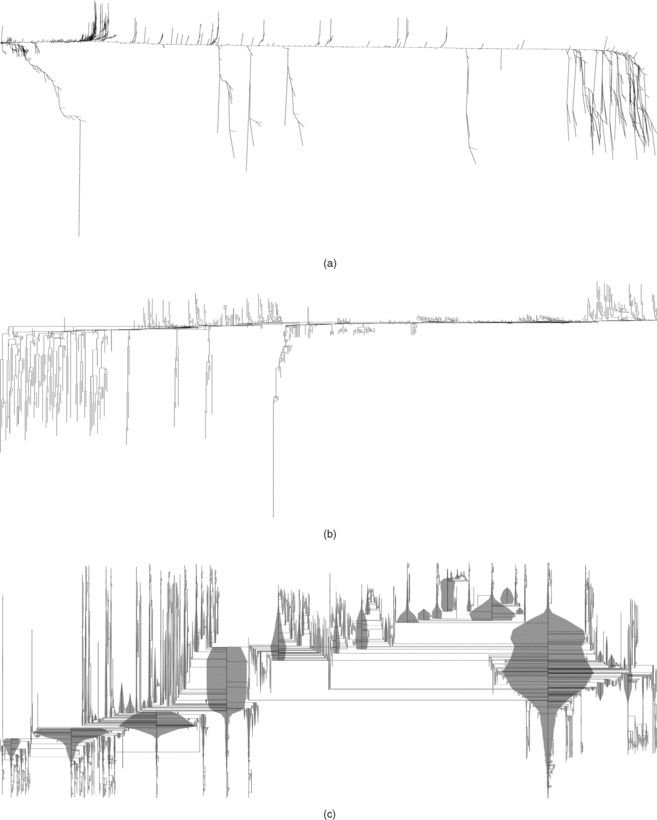
and layout algorithms for displaying large contour trees:
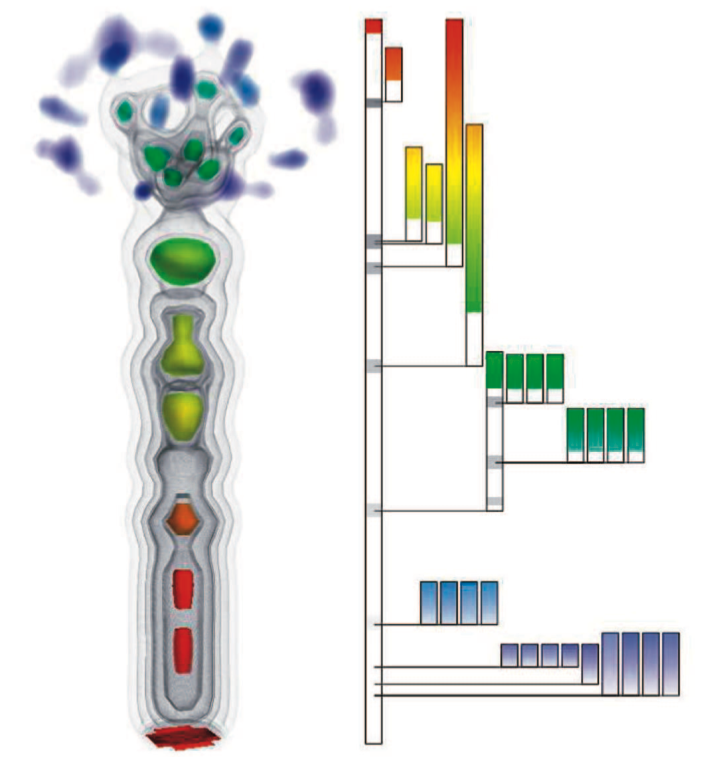
But led to further interfaces, supporting direct volume rendering:
and level set segmentation:

Other Research Topics:
Contour Tree Computation
Isosurface Acceleration
Isosurface Quality
Direct Volume Rendering
Histograms and Isosurfaces
Topological Comparisons
Multivariate Topology
Fiber Surfaces
Aerial Urban LiDAR
Exascale Data Analysis